Download
1 / 24
240 likes | 356 Views
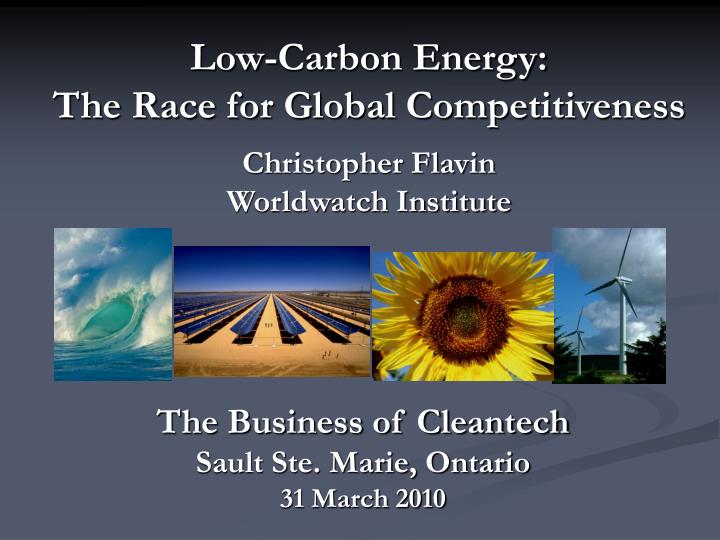
Low-Carbon Energy: The Race for Global Competitiveness Christopher Flavin Worldwatch Institute. The Business of Cleantech Sault Ste. Marie, Ontario 31 March 2010. Global Carbon Dioxide Emissions 1908 - 2008. 12 B. 9 B. tonsC /year. Developing Countries. 6 B. Emerging Economies. 3 B.

E N D
Low-Carbon Energy:The Race for Global CompetitivenessChristopher FlavinWorldwatch Institute The Business of CleantechSault Ste. Marie, Ontario31 March 2010
Global Carbon Dioxide Emissions1908 - 2008 12 B 9 B tonsC/year Developing Countries 6 B Emerging Economies 3 B Developed Nations 0 1908 1928 1948 1968 1988 2008 Source: CDIAC, WEO, C-ROADS
1- CO2 Emissions Per Capita by Country and Region Source: IEA WEO 2007
Carbon Intensity, Select Countries(tons CO2/$GDP) Source: CDIAC, CIA World Factbook
Carbon Intensity, Select States(tons CO2/ $GDP) Source: EIA, BEA
World Price of Oil: 1986 - 2010 Source: EIA
Average Energy Growth Rates by Source: 2003-2008 Source: Worldwatch, BP.
Global Electricity from Renewables 2002-2008 Renewable power generation additions as share of global power generation additions Renewable generation as % of global power generation Source: NEF 2009
World Wind Capacity1996-2008 Source: REN21 2009
World Biofuels Production1990-2008 Source: REN21 2009
World Solar PV Capacity1990-2008 Source: REN21 2009
Cost of New U.S. Power Generation, 2008 Source: Black & Veatech (2007), EIA (2008), Keystone Center (2007), IEER (2008), E3 (2008).
Wind Potential http://www.3tier.com
Renewable Electricity in Germany 1990 - 2007 Source: BMU 2009.
Global Potential of Renewable Resources Source: IEA, Johansson et al.
Stand-Alone Generationvs. Cogeneration Source: EIA/ICF International
Cogeneration Share of National Power Generation Source: IEA
U.S. New Appliance Energy Use 1972-2007 Source: ACEEE
Smart Grid Source: DOE
Existing U.S. Generating Capacity by Initial Year of Operation Source: EIA
Vital Signs Online Vital Signs Online is an interactive, subscription-based tool that provides hard data and research-based insights on the sustainability trends that are shaping our future. Learn more and subscribe at vitalsigns.worldwatch.org