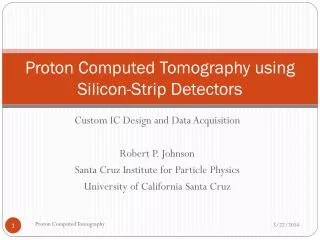
Proton Computed Tomography using Silicon-Strip Detectors
280 likes | 409 Views
This document outlines innovative developments in Proton Computed Tomography (pCT) utilizing silicon-strip detectors and customized integrated circuits. Key aspects include the introduction of a pre-clinical scanner prototype, advanced tracking systems, energy detectors, and a comprehensive data acquisition system. The significance of pCT in proton radiation therapy is highlighted, illustrating its ability to accurately determine range and minimize exposure to healthy tissues. Collaborative efforts from UC Santa Cruz and LLUMC showcase the exciting potential for enhanced cancer treatment through this technology.

Proton Computed Tomography using Silicon-Strip Detectors
E N D
Presentation Transcript
Proton Computed Tomography using Silicon-Strip Detectors Custom IC Design and Data Acquisition Robert P. Johnson Santa Cruz Institute for Particle Physics University of California Santa Cruz Proton Computed Tomography
Collaborators in Building the pCT Scanner • LLUMC: • Reinhard Schulte, M.D. • Vladimir Bashkirov • Ford Hurley • Nick Vence • Valentina Giacometti • U.C. Santa Cruz: • Robert Johnson • Hartmut Sadrozinski • Joel DeWitt • Andriy Zatserklyaniy • Tia Plautz Front-end and DAQ electronics Proton Computed Tomography
Outline • Introduction to pCT • Pre-clinical scanner prototype • Tracking System • Energy Detector • Data Acquisition • Tracker Front-End ASIC • Tracker Performance • Noise occupancy • Hit efficiency • Bad channel rates • DAQ System Performance Proton Computed Tomography
Proton Radiation Therapy Total proton dose vs. depth (sum of blue curves) -ray dose vs. depth The proton beam is tuned such that the protons stop in the tumor, depositing most of their energy there. Compared with photon radiation (X-ray or -ray), a higher does can be delivered to the tumor while minimizing exposure to surrounding tissue. “Bragg Peak” placed in tumor region Zero dose behind the tumor! Energy deposition vs. depth for several beam energies. Proton Computed Tomography
Range Uncertainties (measured with PTR) > 5 mm > 10 mm > 15 mm Schneider U. & Pedroni E. (1995), “Proton radiography as a tool for quality control in proton therapy,” Med Phys. 22, 353. Alderson Head Phantom Why the Interest in Proton CT? X-ray CT use in proton cancer therapy can lead to significant uncertainties in range determination, which limits its use in the case of some tumors located close to critical healthy tissue. Proton CT can measure directlythe density distribution needed for range calculation, is less affected by intervening dense structures, and is unaffected by “beam hardening”. Proton Computed Tomography
Fermi-LAT Tracker/Converter Heritage 73 m2 of Si (>10,000 SSDs) 880,000 channels 160 Watts In orbit since June 2008 Our first prototype pCT scanner used the Fermi Tracker electronics and SSDs, but a much faster, specialized ASIC is needed for clinically realistic rates. W. Atwood et al., Design and Initial Tests of the Tracker-Converter of the Gamma-ray Large Area Space Telescope, Astroparticle Physics 28, 422-434, 2007. Proton Computed Tomography
pCT Instrument Concept • Tracking detectors based on silicon-strip sensors measure track vectors entering and exiting the object being imaged. • From this the protons path through the object is estimated. • A range detector stops the proton and measures the residual range. • From this the Water Equivalent Path Length through the object is inferred. Pair of silicon-strip based trackers. Proton range detector Incoming 200 MeV KE proton U Object being imaged (a calibration device is shown) T V H.F.-W. Sadrozinski et al, Development of a Head Scanner for Proton CT, Nucl. Instr. Meth A 699 (2013) 205. Proton Computed Tomography
The Actual Instrument Tracker Modules Event Builder Range Detector Electronics T V Beam Range Detector Rotating Stage Proton Computed Tomography
Silicon-Strip Sensor Orientations Single-sided, AC coupled, 400m n-on-p HPK sensors, left-over from the Fermi-LAT. Measures V Coordinates We sawed off the sensor edges to minimize the gaps! 384 strips After cut Measures T Coordinates ASICs Proton Computed Tomography
Inside of one Tracker Module Two V boards and two T boards Spartan-6 FPGA V ASIC Proton Computed Tomography
One Tracker “Cassette,” T side Vertical strips T ASICs Spartan-6 FPGAs Power connector DVI connector The T side has twice and many amplifier channels as the V side, and two FPGAs, each with a dedicated data line to the event builder. Proton Computed Tomography
Range Detector Digitizer Board Typical digitized PMT signal. 14-bit 65 MHz ADC (AD9244) Amplifier and differential ADC driver (AD8138) PMT signal FPGA Fast inverting amplifier Each of the 5 channels has a 14-bit 65 MHz pipeline ADC plus a separate amplifier and discriminator for triggering. Threshold DAC Trigger comparator with LVDS output Proton Computed Tomography
Designed to read out more than a million proton events per second. Data Acquisition Concept Triggered readout, not data driven. 32 SSD total SSD (½ V or ¼ T) SSD (½ V or ¼ T) 144 ASIC total ASIC ASIC LVDS (Printed Circuits) 1 Spartan-6 FPGA per V board; 2 per T board FPGA FPGA FPGA FPGA FPGA FPGA FPGA FPGA FPGA FPGA FPGA FPGA LVDS (DVI Cables) 100 Mbps per LVDS link 9 MHz clock sync. from accelerator Virtex-6 Event Builder 4 V layers 4 T layers Five-Stage Scintillator ADCs FPGA FPGA ADCs 800 Mbps V layers have 12 ASICs T layers have 24 ASICs Ethernet During acquisition of image data, the system is triggered by the first scintillator stage. DAQ Computer Proton Computed Tomography
pCT Tracker ASIC Layout TSMC 0.25 micron CMOS • 100 MHz digital clock and 100 Mbps LVDS data output. • Single-threshold digitization (binary output). • 64 amplifiers are always active and supply a 64-wide-OR trigger as well as data. • Output data are formatted as a list of clusters (first strip and number of strips). Proton Computed Tomography
R. Johnson et al., Tracker Readout ASIC for Proton Computed Tomography Data Acquisition, IEEE Trans. Nucl. Sci. 60, 3262-3269, 2013 ASIC Features • Internal calibration system to pulse any set of channels with a programmable charge. • RC/CR pulse shape with 200 ns peaking time. • Two gain options. • Also a 400 ns peaking time option. • Extra optional inverter for p-on-n SSDs. • Threshold programmed by an 8-bit DAC common to all channels. • Digital 1-shot on each channel to define a hit window comparable to the accelerator beam RF period (~110 ns). • 64-wide OR for self triggering. • Two 64-bit masks to isolate noisy channels from the trigger and/or data stream. • 32 deep FIFO to hold the hits during trigger latency. • 4 independent event buffers, each with a processor to form the cluster lists for output. • Digital commands to configure the system, load registers, and verify registers. • e.g. set sample clock frequency. Proton Computed Tomography
ASIC Noise Performance • The relatively large total bias current on the edge-cut SSDs does not impact the strip noise performance. • ENC = 280 + 35 CpF electrons • The expected signal from a 200 MeV proton is about 60,000 electrons, so there is excessive noise margin! • It would be advantageous to go to 200 m SSDs to reduce multiple scattering. • Gain variation: • 2% rms within a chip • 5% rms chip to chip Example threshold scans for eight adjacent channels. 18-cm long SSD strips (V-board strips). From the erfc fits, the noise sigma is about 1100 e. Hold the charge-injection level constant and measure the detection efficiency versus discriminator threshold. Efficiency 60 120 Threshold DAC Setting Analog power: 1.2 mW/channel Digital power: 2.3 mW/channel (100 MHz) Proton Computed Tomography
Noise Occupancy (Random Triggers) Thus the amplifier noise is nearly negligible. The few noisy strips that are present in the system are due to defective SSD strips. The signal from our highest momentum protons is over 9 fC Note: fC scale presently has an uncertainty of up to 30%. Proton Computed Tomography
Tracker Hit Efficiency • To minimize confusion from overlapping protons, the time window to capture a hit must be less than about 100 ns. • Hence the threshold must be set low enough relative to the expected signal that time jitter will be low. • And the efficiency of getting all 8 SSD hits must be high. • We have no redundant detector planes, except that in the front telescope the beam spot can substitute for one measurement. • If a hit is missing and the track projects close to a known dead strip or a gap, that location can be assumed to be hit. • This emphasizes the great importance of having high signal/noise. Proton Computed Tomography
The measured hit efficiency generally lies between 98% and 99%, including gaps between detectors and bad strips. Tracking resolution near the edge of the acceptance Gaps between sensors Bad strips Note: the SSDs were run under-depleted at 75V bias (full depletion requires about 100V). Proton Computed Tomography
Bad Channels • The ASICs were not tested prior to assembly, and so far the yield has been 100% out of about 200 chips. • Noisy and dead channels typically are due to bad detector strips, not the ICs. • We found only 24 such channels in the system, out of 9216 channels, or about 0.3%. • These are leftover Hamamatsu-Photonics sensors from fabrication of the tracker of the Fermi orbiting gamma-ray telescope. Proton Computed Tomography
Residuals from Straight-Line Fits (Before making alignment corrections.) Proton Computed Tomography
Data Acquisition Rate Trigger Rate Acquired-Event Rate The accelerator spill intensity needs to be improved in uniformity, but the instrument succeeds in delivering our goal of a million events per second. Proton Computed Tomography
Conclusions • Our pCT scanner is now fully operational and able to take data at an event rate above 1 MHz. • The Tracker ASIC met all of our requirements in the first submission and had a very high yield. • The custom data acquisition system based on FPGAs meets our goal of >1 million protons per second. • Future goals: • Increase the proton rate up to 5 to 10 MHz by designing and building a segmented range detector (to measure simultaneous protons). • This could get the scan time down to 1 or 2 minutes. • Transfer the technology to industry (e.g. Varian). Proton Computed Tomography
Extra Slides Proton Computed Tomography
Residuals from Straight-Line Fits Proton Computed Tomography