Download
1 / 25
260 likes | 809 Views
Rate of things via spectrophotometry. Aph 162, Winter 2009 Week 2. Overview. Spectrophotometry The Beer-Lambert law Some weird units: OD 600 and cfu ’s Calibration: a standard curve (OD 600 vs. cfu) Bacterial growth curves Growth on a single carbon source

E N D
Rate of things viaspectrophotometry Aph 162, Winter 2009 Week 2
Overview • Spectrophotometry • The Beer-Lambert law • Some weird units: OD600 and cfu’s • Calibration: a standard curve (OD600 vs. cfu) • Bacterial growth curves • Growth on a single carbon source • Growth on a two carbon sources (diauxic growth/catabolite repression) • Experiments for today
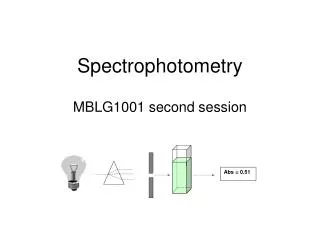
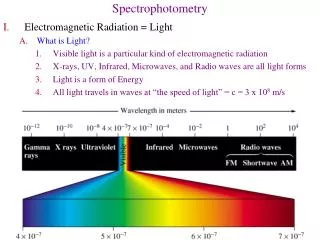
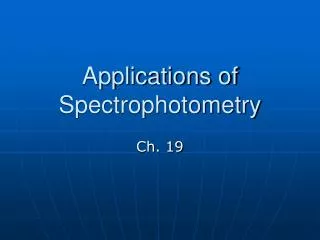
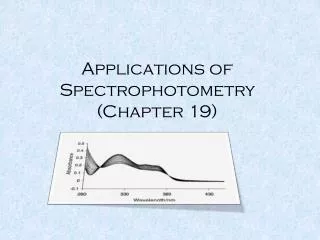
Spectrophotometry: The Beer-Lambert law • Relates concentration to the optical measurement of ‘absorbance’ • Example: E. coli concentration • Combined with spectrophotometry can be used to distinguish and compare different molecules in solution • Example: Chlorophyll spectrum
z σ The Beer-Lambert law • I0 = incident light (W/cm^2) • c = Number density of absorbers (e.g. cells) • σ(λ)= particle cross section (cm^2) • l = width of cuvette(usually 1cm)
The Beer-Lambert law z σ • I0 = incident light (W/cm^2) • c = Number density of absorbers (e.g. cells) • σ(λ)= particle cross section (cm^2) • l = width of cuvette (usually 1cm) • For dilute samples: dIz/Iz =-σ·c·dz I1 (λ) = I0e-σ(λ)·c·l= I010-ε(λ)·c·l
The Beer-Lambert law z σ • I0 = incident light (W/cm^2) • c = Number density of absorbers (e.g. cells) • σ(λ)= particle cross section (cm^2) • l = width of cuvette (usually 1cm) • For dilute samples: dIz/Iz =-σ·c·dz I1 (λ) = I0e-σ(λ)·c·l= I010-ε(λ)·c·l • Absorbance=A(λ)= -log(I1/I0)=ε·c·l
The Beer-Lambert law z σ • I0 = incident light (W/cm^2) • c = Number density of absorbers (e.g. cells) • σ(λ)= particle cross section (cm^2) • l = width of cuvette (usually 1cm) • For dilute samples: dIz/Iz =-σ·c·dz I1 (λ) = I0e-σ(λ)·c·l= I010-ε(λ)·c·l • Absorbance=A(λ)= -log(I1/I0)=ε·c·l • ODλ=600=A/l = ε(λ=600nm)·c ~ c • Units of OD: per unit length
Calibration – measuring background Always need to measure “blank” - just medium. The spectrophotometer subtracts this measurement from the actual measurement
A standard curve • OD600 doesn’t give absolute cell concentration • OD600 is cell dependent • Need to independently measure cell concentration so that the two can be related. This is called a standard curve.
A standard curve (cont.) • Measure absolute cell concentration by dilution and plating. • Plating measures cfus = colony forming units • Standard curve = plot OD600 vs. cfu
How to do it in the lab Plate every 30min Try DX10 and D/10 as well Next day: http://micro.fhw.oka-pu.ac.jp/lecture/exp/images/cfu-7.jpg
Growth phases • Lag phase • Occurs upon inoculation • Duration depends on history of inoculum (exponential/stationary/damaged/type of medium)
Growth phases • Exponential phase • Healthy cells • Cell number increases exponentially with a well defined doubling time • Reproducible physiological state • OD600 ~ 0.1 • Doubling times can be 20mim, hours, weeks and even months depending on the organism and growth medium
Growth phases • Stationary phase • Population reaches steady state because • An essential nutrient becomes limiting • A waste product generated by the culture inhibits further growth • Physiological state of cell completely changes: cells are in stress
Bacterial growth curves –two carbon source: catabolite repression Catabolism: biochemical reaction leading to production of usable energy
How does it work? CAP activator (constitutive) LacI repressor cAMP Allolactose CAP = catabolite activator protein glucose lactose
High glucose: Catabolite repression OFF High glucose When glucose is present → no activator → this operon as well as operons for other sugars are shut off.
Low glucose: Lactose switch OFF High glucose Lactose: High = ON Low glucose Low = OFF
When will the diauxic shift occur? Experimental setup: • 1L of glucose at 0.1g/L • Inoculums at t=0 is 10mL of saturated E. coli culture (@ OD600 = 1.5) • Rich medium (with casamino acids) • Doubling time: 20 min • Aerobic growth
Experiments for today • Choose a growth medium • Glucose+Lactose/Matlose/Sorbitol (1:1 ratio, 0.1 g/L) • Measure OD600 every 5-10min (esp. near shift) • Don’t forget to blank before each measurement! • Minimize time incubator is open • Shift should occur at OD~0.25 • Every ~30 min plate cells • Remember: OD600=1 ↔ 109 cells/mL • Note absolute time
Homework • Plot growth curve on a log scale • Identify all growth phases • Analyze your results in light of our discussion on catabolite repression • Extract doubling times by linear regression • Do your values make sense? • Plot standard curve (OD600 vs. cell count) • Is it linear? Are there errors? Why?