Download

1 / 48
570 likes | 1.76k Views
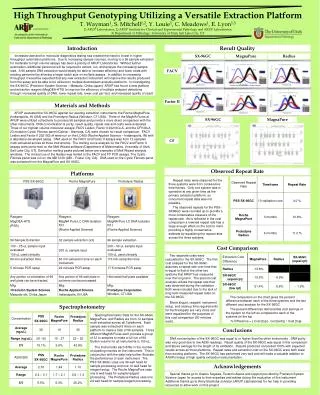
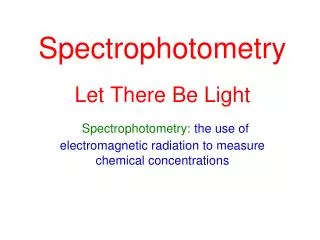
Color. Spectrophotometry. of F o o d D y e s. & Beer’s Law. A = ε b c. Concentration. Questions. OBJECTIVES. What is the quantitative basis for the color of substances?. How is the absorption/transmission of light measured?.

E N D
Color Spectrophotometry of FoodDyes & Beer’s Law A= ε bc Concentration
Questions OBJECTIVES What is the quantitative basis for the color of substances? How is the absorption/transmission of light measured? How is the intensity of color related to the concentration of colored solutions? What considerations go into graphing experimental data?
Concepts, Techniques • Concepts: • Absorbance Absorption • Absorptivity Analytical Wavelength • Beer’s Law Blank • Concentration Electromagnetic Spectrum • Incident Intensity • Spectroscopy Spectrum • Transmittance Wavelength Purpose
Concepts, Techniques • Techniques: • Visible Spectroscopy Quantitative dilution • Graphing Plotting /Curve fitting • Apparatus: • Recording Spectrophotometer • Spectronic 20 • Pipet/Syringe Cuvette Purpose
BACKGROUND For a simple, transparent, COLORED material, e.g. ROYGBV ROYGBV Incident white light Transmitted light It(λ) Ii(λ) VIOLET CLEAR SOLUTION Can plot a graph showing the percent of light of each discrete COLOR (wavelength, λ) transmitted by the solution It(λ) Percent Transmittance 100 X %T(λ) = Ii(λ)
% Transmittance of White Light by a Violet Solution Or, instead, we can plot the percent of light absorbed % Transmitted Wavelength (nm) ← UV IR Violet Blue Green Yellow Red
% Absorbed of White Light by a VioletSolution % Absorbed = 100% - % Transmitted % Absorbed Violet Blue Yellow Red Green
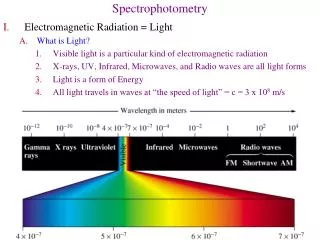
What determines the WAVELENGTHS of light that substances absorb? VISIBLE AND ULTRAVIOLET: Electronic structure of molecules λ= 100 nm – 800 nm INFRARED REGION: Vibrations of molecules 800 nm – 100 m nm = nano meter = 10-9 m What determines INTENSITY of absorption? EFFICIENCY of INTERACTION between Molecules & Electromagnetic Radiation
Which DEVICE measures this phenomenon? ASPECTROPHOTOMETER measures the RELATIVEabsorption of light of DIFFERENT WAVELENGTHS by a substance SOURCE of light, MONOCHROMATOR– an element to select particular wavelengths SAMPLE & CONTAINER DETECTOR to measure intensity of light transmitted through sample, and ELECTRONICS to translate detector output into numbers
Detector output depends on intensity, wavelength & instrumental factors. Other substances may also absorb. Therefore, we always measure RELATIVE output of detector, where RELATIVE means compared with: EVERYTHING BUT THE SAMPLE ( a BLANK ) • Sample container • Solvent • Other reagents, etc. [Water] [None] e.g., a solvent, a container, another colored substance etc. - = E.g., the rods and cones of the human eye % Absorbance % Absorbance % Absorbance BLANK + SAMPLE BLANK SAMPLE This insures that measured Absorbance of light is due only to the substance of interest
How is the amount of COLOR absorbed by a chemical species related to the CONCENTRATION of that species? BEER-LAMBERT LAW (1760 - 1852) Amount of light absorbed by a transparent solution is proportional to the thickness of the solution & concentration of the absorbing species absorbance = constant x path length x concentration A= ε bc A = ABSORBANCE at a specified wavelength ε = ABSORPTIVITY, a constant characteristic of the substance at that wavelength (does not depend on the amount or concentration of the sample) b=PATH LENGTH of the light through sample, i.e., cell thickness c=CONCENTRATIONof the absorbing substance
I0 −−−− It Definition of Absorbance Smaller It means larger A A = log It −−−− I0 How is Absorbance related to %Transmittance? I0 It %T = 100 100 A = log −−−− %T = log 100 - log %T A = 2.000… - log %T
Beer’s Law states that% transmittance is proportional to path length & concentration • True • False
A= ε bc Beer’s Law states ABSORBANCE is proportional to concentration B= False 1. Memory 2. Common Sense: A solution with larger concentration must be darker &, therefore, absorb more and transmit less light! I.e., have a smaller %T.
A= ε bc What do we need to know to relate Absorbance to concentration? Need to know: ABSORPTIVITY, ε , AND THICKNESS OF THE CUVETTE,b OR at least, their product, εb The name given to the sample cells that we will use
How do we proceed experimentally? 1.) Determine the substance’s SPECTRUM in the desired wavelength range – i.e. absorbance as a function of wavelength 2.) Find WAVELENGTH at which the substance has the LARGEST ABSORBANCE (lowest%Transmittance) The Absorbance will be most sensitive to concentration at this wavelength This wavelength is called the ANALYTICAL WAVELENGTH
2.) Then we prepareseries of solutions of KNOWNCONCENTRATIONSof the substance c/8 c/4 c/2 c 3.)MeasureABSORBANCEof each solution at itsANALYTICAL WAVELENGTH
Tabulate the data BLANK and 4.) Plot ABSORBANCEvsCONCENTRATION
SUPL-004 SLOPE = / Abs = log (I0/I) = 0.0263 L/mg 25.0 25.0 0.658 0.658 Note : Absorbance is dimensionless. BLANK 20
Slope of Beer’sLaw plot is ε X b, where ε = the absorptivity of the substance b = the cell thickness If we use identical (i.e., matched) cells for blank & sample, we do not need to know the quantities ε& b separately. Beer’s Law expression for Red #2 at its analytical wavelength in this cell becomes: A = 0.0263 X C (where C is in mg/L) Unitsof the slope of the Beer’s Law plotare (always) reciprocal concentration(e.g., L / mg)
A Beer’s Law plot has a slope of 0.0263 L / mg. The absorbance of a solution is measured to be 0.263. What is the concentration of the solution?Please make your selection... • 0.100 mg / L • 1.00 mg / L • 10.0 mg / L • 100. mg / L • It depends on the blank
Slope = 0.0263 L / mg Abs = 0.0263 X c (c in mg/L) Abs = 0.263 c = 0.263 / 0.0263 = 10.0 mg / L C 10.0 mg / L
In this exercise, we examine spectrophotometric properties of 7 FOODDYES 7 substances approved by Food and Drug Administration ( FDA ), for use as colorants in foods Each dye is a single complex organic compound. For simplicity they are called: Blue 1, Blue 2, Green 3, Yellow 5, Yellow 6, Red 3, and Red 40 We will further examine dyes and their chemical properties next week
Blue 2 Yellow 6
PROCEDURE WORK IN PAIRS • Pair obtains 50 mL of ONE • assigned dye solution 2. Determine SPECTRUM (abs vs) of diluted stock solution between 350 nm and 750 nm Using recording spectrophotometer
3. Determine ANALYTICAL WAVELENGTH, i.e., wavelength of maximum absorbance. 4. Prepare dilutions of stock solution of precisely known concentration 3/4, 1/2, 1/4, 1/8, and 1/16 5. Determine ABSORBANCEof stock solution & dilutions at analytical wavelength • most dilute solution (1/16) first, • next most dilute solution (1/8), etc.
Procedure Schedule Why can’t you make Beer’s Law absorbance measurements before determining spectrum? • You will be assigned a partner and ONE dye 2. All pairs begin by preparing dilutionsfor Beer’s Law While doing that: TAs send one pair at the time to the recording spectrophotometerto obtain spectrum of the dye.
2 PAIRSwillSHAREONE SPECTRONIC 20 In Part 2 (Beer’s Law) • In part 2 (Beer’s Law - Groups of two should use spectrophotometers in series • i.e., group 1 does a completeBeer’s Law data acquisition • sets wavelength • check blank • measure dye1 / conc1 • measure dye1 / conc2, etc. • When group 1finishes, • group 2 resets Spectronic 20 and does the same for its dye This process avoids resetting spectrophotometer after each measurement Do NOT try to interleave two groups’ measurements
6. Prepare BEER'S LAW PLOT BY HAND! Use rules in SUPL-004
Concepts, Techniques • Concepts - Graphing: • Abscissa Ordinate • Scale Slope • Intercept Independent Variable • Dependent Variable Grid • Portrait Landscape • Orientation Range • Graph Grid Lines Purpose
SUPL-004 Summary • The principal rules for drawing graphs described in SUSB-004 are: • The abscissa (x-axis) shall generally represent the • independent variable. The dependent variable is • therefore represented by the ordinate (y-axis) • The scales shall use 1, 2, or 5 units or decimal • submultiples or multiples thereof per mm. I.e., • 1 mm = 0.01, 0.02, 0.05, 0.1, 0.2, 0.5, 1, 2, 5,… units • The orientation (portrait or landscape) shall be • chosen to maximize the plot area dependent landscape portrait independent
Portrait or Landscape? SUPL-004 1 Box (mm) must represent a multiple or submultiple of 1, 2 or 5 units (not 3 or 4) 180 mm: 180, 180/2 = 90, 180/5 = 36, 180/10 = 18, 180/20 = 9,180/50 = 3.6, 180/100 =1.8, …. max units 180 - 1 mm marks 250 mm : 250X5=1250, 250X2= 500, 250, 250/2= 125, 250/10= 25, 250/20 = 12.5, 250/50 = 5, 250/100 = 2.5, … max units Independent variable is plotted on X-axis 250 - 1 mm marks
6. Prepare BEER'S LAW PLOT BY HAND! Use rules in SUPL-004 7. Determine SLOPE of best straight line passing through the origin. 8. Finally, using Beer’s Law, and the slope, determine concentration of an unknown solution of the same dye whose spectrum you have studied. c = abs / slope
WAVELENGTH ADJUSTMENT: sets wavelength (color) ZERO ADJUSTMENT: sets 0% transmittance – calibrates detector Needs only Periodic checking after warm-up LIGHT CONTROL: sets 100 % transmittance Needs readjustment before every measurement of a sample. (Using BLANK)
Some elements of common sense in using the spectrophotometer • Transmittance can never be > 100% (Abs< 0) • If you get such a reading, check the amplifier adjustment. 0% transmittance setting may have drifted. • Sometimes air bubbles form in BLANK (or in the dye solution) • Cuvettes should always be aligned the same way in the sample compartment • Look for a mark on the cuvette. The mark should face front of the spectrophotometer
DILUTION CALCULATIONS Need to prepare accurate dilutions of stock solutions Concentration = Amount / Volume (e.g.,mg/L) Amount (mg) = Concentration (mg / L) X Volume ( L) Start: Volume = V1 at Conc1 Add some solvent End: Volume = V2 at Conc2 What is Conc2? Have added no additional reagent, so AMT2 = AMT1 || Conc2 x V2 || Conc1 x V1 = V2 C2 V1 Conc2 = Conc1 x ------V2 V1 C1
E.g., 25 mL of a solution with a concentration of 30 mg/L of Red 3 is diluted to 75 mL (by adding 50 mL ofdistilled water). What is the final concentration of Red 3? V1 Conc2 = Conc1 x --- V2 25 mL Final Conc=30 mg/Lx--------= 10 mg/L 75 mL
What is the concentration of a solution made by diluting 15.0 mL of a 2.50 M solution to 150. mL? • 0.250 M • 1.50 M • 25.0 M
What is the concentration of a solution made by diluting 15.0 mL of a 2.50 M solution to 150. mL? 15.0 mL Conc2=2.50Mx----------=0.250 M 150 mL A0.250 M
NEXT EXERCISE PAPER CHROMATOGRAPHY OF FOOD DYES Read SUSB – 009 Do Pre-Lab for SUSB – 009 (Hand in at beginning of lab period)
ANY ? QUESTIONS
Gorilla 5 point penalty NO ADMITTANCE TO THE LAB WITHOUT SAFETY GOGGLES
What Help is Available? Lecture Notes Flow Charts Concept Maps Web Supplements Lecture Videos Help Sessions Faculty Office Hours