Download
1 / 21
210 likes | 342 Views
This comprehensive guide introduces you to the principles and applications of spectrophotometry in chemistry. Learn about colorimetry, properties of light, absorption of light, Beer’s Law, and more. Understand how spectrophotometers work and their role in measuring chemical concentrations accurately.

E N D
SPECTROPHOTOMETRY Applied Chemistry
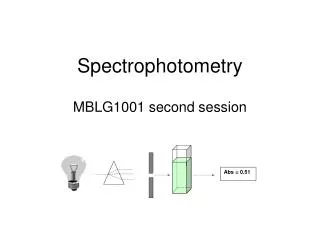
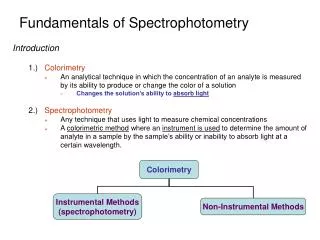
Fundamentals of Spectrophotometry • Introduction 1.) Colorimetry • An analytical technique in which the concentration of an analyte is measured by its ability to produce or change the color of a solution • Changes the solution’s ability to absorb light 2.) Spectrophotometry • Any technique that uses light to measure chemical concentrations • A colorimetric method where an instrument is used to determine the amount of analyte in a sample by the sample’s ability or inability to absorb light at a certain wavelength. Colorimetry Instrumental Methods (spectrophotometry) Non-Instrumental Methods
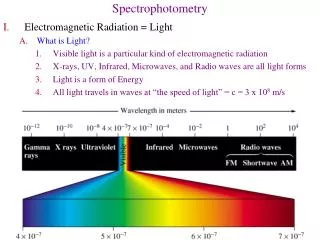
Fundamentals of Spectrophotometry • Properties of Light 1.) Particles and Waves • Light waves consist of perpendicular, oscillating electric and magnetic fields • Parameters used to describe light • amplitude (A):height of wave’s electric vector • Wavelength (l): distance (nm, cm, m) from peak to peak • Frequency (n): number of complete oscillations that the waves makes each second • Hertz (Hz): unit of frequency, second-1 (s-1) • 1 megahertz (MHz) = 106s-1 = 106Hz
Fundamentals of Spectrophotometry • Properties of Light 1.) Particles and Waves • Parameters used to describe light • Energy (E): the energy of one particle of light (photon) is proportional to its frequency where: E = photon energy (Joules) n = frequency (sec-1) h = Planck’s constant (6.626x10⁻³⁴J-s) As frequency (n) increases, energy (E) of light increases
Fundamentals of Spectrophotometry • Properties of Light 1.) Particles and Waves • Relationship between Frequency and Wavelength • Relationship between Energy and Wavelength where: c = speed of light (3.0x10⁸ m/s in vacuum)) n = frequency (sec-1) l = wavelength (m) where: = (1/l) = wavenumber As frequency (l) decreases, energy (E) of light increases
Fundamentals of Spectrophotometry • Properties of Light 2.) Types of Light – The Electromagnetic Spectrum • Note again, energy (E) of light increase as frequency (n) increases or wavelength (l) decreases
Fundamentals of Spectrophotometry • Absorption of Light 1.) Colors of Visible Light • Many Types of Chemicals Absorb Various Forms of Light • The Color of Light Absorbed and Observed passing through the Compound are Complimentary
Fundamentals of Spectrophotometry • Absorption of Light 2.) Ground and Excited State • When a chemical absorbs light, it goes from a low energy state (ground state) to a higher energy state (excited state) • Only photons with energies exactly equal to the energy difference between the two electron states will be absorbed • Since different chemicals have different electron shells which are filled, they will each absorb their own particular type of light • Different electron ground states and excited states Energy required of photon to give this transition: DE = E1 - Eo
Fundamentals of Spectrophotometry • Absorption of Light 3.) Beer’s Law • The relative amount of a certain wavelength of light absorbed (A) that passes through a sample is dependent on: • distance the light must pass through the sample (cell path length - b) • amount of absorbing chemicals in the sample (analyte concentration – c) • ability of the sample to absorb light (molar absorptivity - e) Increasing [Fe2+] Absorbance is directly proportional to concentration of Fe+2
Fundamentals of Spectrophotometry • Absorption of Light 3.) Beer’s Law • The relative amount of light making it through the sample (P/Po) is known as the transmittance (T) Percent transmittance T has a range of 0 to 1, %T has a range of 0 to 100%
Fundamentals of Spectrophotometry • Absorption of Light 3.) Beer’s Law • Absorbance (A) is the relative amount of light absorbed by the sample and is related to transmittance (T) • Absorbance is sometimes called optical density (OD) A has a range of 0 to infinity
Fundamentals of Spectrophotometry • Absorption of Light 3.) Beer’s Law • Absorbance is useful since it is directly related to the analyte concentration, cell pathlength and molar absorptivity. • This relationship is known as Beer’s Law where: A = absorbance (no units) e = molar absorptivity (L/mole-cm) b = cell pathlength (cm) c = concentration of analyte (mol/L) Beer’s Law allows compounds to be quantified by their ability to absorb light, Relates directly to concentration (c)
Fundamentals of Spectrophotometry • Absorption of Light 4.) Absorption Spectrum • Different chemicals have different energy levels • different ground vs. excited electron states • will have different abilities to absorb light at any given wavelength • Absorption Spectrum – plot of absorbance (or e) vs. wavelength for a compound • The greater the absorbance of a compound at a given wavelength (high e), the easier it will be to detect at low concentrations
Fundamentals of Spectrophotometry • Spectrophotometer 1.) Basic Design • An instrument used to make absorbance or transmittance measurements of light is known as a spectrophotometer
Fundamentals of Spectrophotometry • Spectrophotometer 1.) Basic Design • Light Source: provides the light to be passed through the sample • Tungsten Lamp: visible light (320-2500 nm) • Deuterium Lamp: ultraviolet Light (160-375 nm) • - based on black body radiation: • heat solid filament to glowing, light emitted will be characteristic of temperature more than nature of solid filament Low pressure (vacuum) Tungsten Filament In presence of arc, some of the electrical energy is absorbed by D2 (or H2) which results in the disassociation of the gas and release of light D2 + Eelect D*2 D’ + D’’ + hn (light produced) Excited state
Fundamentals of Spectrophotometry • Spectrophotometer 1.) Basic Design • Wavelength Selector (monochromator): used to select a given wavelength of light from the light source • Prism: • Filter:
Fundamentals of Spectrophotometry • Spectrophotometer 1.) Basic Design • Sample Cell: sample container of fixed length (b). • Usually round or square cuvet • Made of material that does not absorb light in the wavelength range of interest • Glass – visible region • Quartz – ultraviolet • NaCl, KBr – Infrared region
Fundamentals of Spectrophotometry • Spectrophotometer 1.) Basic Design • Light Detector: measures the amount of light passing through the sample. • Usually works by converting light signal into electrical signal Process: a)light hits photoemissive cathode and e- is emitted. b) an emitted e- is attracted to electrode #1 (dynode 1), which is 90V more positive. Causes several more e- to be emitted. c)these e- are attracted to dynode 2, which is 90V more positive then dynode 1, emitting more e-. d) process continues until e- are collected at anode after amplification at 9 dynodes. e) overall voltage between anode and cathode is 900V. f) one photon produces 106 – 107 electrons. g) current is amplified and measured Photomultiplier tube
Fundamentals of Spectrophotometry • Chemical Analysis Calibration • To measure the absorbance of a sample, it is necessary to measure Po and P ratio • Po – the amount of light passing through the system with no sample present • P – the intensity of light when the sample is present • Po is measured with a blank cuvet • Cuvet contains all components in the sample solution except the analyte of interest • P is measured by placing the sample in the cuvet. • To accurately measure an unknown concentration, obtain a calibration curve using a range of known concentrations for the analyte
Single-beam Spectrophotometer Double-beam Spectrophotometer