Enhancing Molecular Diagnostics: Efficiency and Cost-Effectiveness with the SX-96GC Platform
The growing demand for molecular diagnostics has necessitated advanced automation, driving ARUP Laboratories to adopt the SX-96GC platform for DNA extraction. This new system allows for the simultaneous processing of 96 samples, significantly improving assay efficiency and result quality. The SX-96GC, paired with the MagDEA-HTS extraction reagent, demonstrates lower repeat rates, enhanced DNA quality, and reduced costs. A thorough evaluation against existing systems confirmed its superior performance, paving the way for streamlined workflows and reliable results in clinical settings.

Enhancing Molecular Diagnostics: Efficiency and Cost-Effectiveness with the SX-96GC Platform
E N D
Presentation Transcript
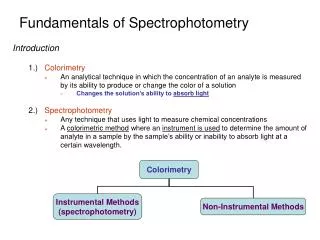
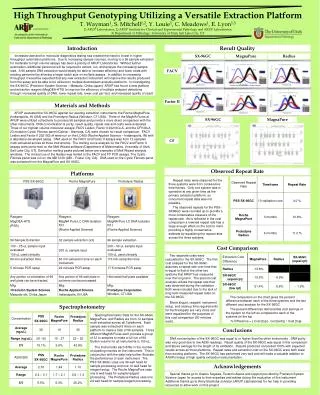
Introduction Result Quality Increased demand for molecular diagnostics testing has created the need to invest in higher throughput automation platforms. Due to increasing sample volumes, moving to a 96 sample extraction for moderate to high volume assays has been a priority of ARUP Laboratories. Without further automation, additional personnel will be required to extract, run, and analyze the increasing sample load. A 96 sample DNA extraction would ideally be able to increase efficiency and lower costs with existing personnel by allowing a larger batch size on multiple assays. In addition to increasing throughput it would be expected that any new extraction instrument will improve the results produced from the assay and be able to be utilized on multiple downstream analysis platforms. In investigating the SX-96GC (Precision System Science – Matsudo, Chiba Japan) ARUP has found a new platform and extraction reagent (MagDEA-HTS) to improve the efficiency of multiple endpoint detections through: increased quality of DNA, lower repeat rate, lower cost per test, and increased quality of result. SX-96GC MagnaPure Radius High Throughput Genotyping Utilizing a Versatile Extraction PlatformT. Wayman1, S. Mitchell1,2, Y. Louie1, C. Meadows1, E. Lyon1,31) ARUP Laboratories; 2) ARUP Institute for Clinical and Experimental Pathology and ARUP Laboratories; 3) Department of Pathology, University of Utah, Salt Lake City, UT mut neg mut neg mut neg FACV - Green curve is a failure of that sample mut neg mut neg mut neg Factor II 20209 20209 Materials and Methods 20209 ARUP evaluated the SX-96GC against our existing extraction instruments; the Roche MagnaPure (Indianapolis, IN USA) and the Protedyne Radius (Windsor, CT USA). Three of the MagNA Pures at ARUP were utilized collectively to process 96 samples and provide a more direct comparison with the other instruments. DNA concentration & purity, result quality, repeat rate and costs were evaluated. Three of our highest volume molecular assays; FACV Leiden, Factor II 20210G>A, and the CFV30LA 23 mutation Cystic Fibrosis panel (Celera – Alameda, CA) were chosen for result comparison. FACV Leiden and Factor II 20210G>A were run on the LC480 (Roche Applied Science – Indianapolis, IN) with a laboratory developed assay. DNA used on the FACV and Factor II assays was from 12 samples multi-extracted across all three instruments. The melting curve analysis for the FACV and Factor II assays were performed on the Melt Wizard software (Department of Mathematics, University of Utah, Salt Lake City, UT). Derivative melting peaks pictured below are examples of Melt Wizard analysis windows. The clinical use of the Radius was limited to the FACV and PT PCR assays. The Cystic Fibrosis panel was run on the ABI 3130 (ABI – Foster City, CA). DNA used on the Cystic Fibrosis panel was extracted from the MagnaPure and SX-96GC. SX-96GC MagnaPure CF Observed Repeat Rate Platforms Repeat rates were observed for the three systems were from consecutive time frames. Only one system was in operation at any given time as the primary extraction platform, so concurrent repeat data was not possible. The observed repeats for the PSS-SX96GC were rounded up to provide a more conservative measure of the repeat rate. As is reflected in the cost comparison a lowered repeat rate has a large enough effect on the cost to merit providing a highly conservative estimate by equalizing the repeat rates across the three systems. Cost Comparison Two separate costs were calculated for the SX-96GC. The first cost analysis for the SX-96GC assumes a repeat rate over time that is equal to that of the other two systems that ARUP has measured over the long term. The second cost analysis utilizes the repeat rate that was observed during the validation. Both were included due to the lack of long term measured repeat rates on the SX-96GC. Blood aliquot, reagent/ instrument setup, and cleanup time requirements for Technologists are very close and were equalized for the purposes of this cost comparison (50 minutes each). The comparison on the chart gives the percent difference between each of the three systems and the two different cost analysis for the SX-96GC. The percent differences demonstrate cost savings of the system on the left as compared to each of the systems on the top % Difference = ( Cost [top] - Cost [left] ) / Cost [top] Spectrophotometry Spectrophotometric Data for the SX-96GC, MagnaPure, and Radius are from 12 samples multi-extracted across all 3 platforms. Each sample was extracted 8 times on each platform to make a total of 96 samples. Three different MagNA Pures each process a group of 32 to samples to make a full run of 96. Elution volume for all instruments is 100 uL. The instruments each differ in the number of pipetting nozzles on the instrument. This in conjunction with the data help further illustrate the performance of each instrument. The PSS SX-96GC uses one 96 well head for sample processing and one 12 well head for reagent setup. The Roche MagnaPure uses one 8 well head for sample/reagent processing. The Protedyne Radius uses one 24 well head for sample/reagent processing. Conclusions DNA concentration of the SX-96GC was equal to or higher than the other instruments. DNA purity was very good due to low A280 readings. Result quality of the SX-96GC was equal in this comparison and above average for the length of its validation. Results produced concorded 100% with expected results across all three platforms. Repeat rates and extraction cost on the SX-96GC were both lower than existing platforms. The SX-96GC has performed very well and will make a valuable addition to ARUPs lineup of high quality extraction instrumentation. Acknowledgements Special thanks go to Osamu Segawa, Tsutomu Asano and support provided by Precision System Science Japan for access to their expertise and advise during the evaluation of this instrument. Additional thanks go to Kerry Elenitoba-Johnson (ARUP Laboratories) for her help in providing resources to allow work on this project.