Download
1 / 17
270 likes | 2.27k Views
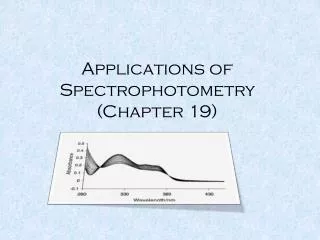
Applications of Spectrophotometry. Ch. 19. Analysis of a Mixture. The absorbance of a solution at any wavelength is the sum of the absorbances of all species in the solution A= ε x b [X] + ε y b [Y] + ε z b [Z]….

E N D
Analysis of a Mixture • The absorbance of a solution at any wavelength is the sum of the absorbances of all species in the solution • A= εxb[X] + εyb[Y]+ εzb[Z]…. • We can use simultaneous equations at different wavelengths if there is little overlap at these wavelengths in order to solve for two species, but for more it is best to use excel
When we have species whose spectra overlap, we can use beer’s law, to calculate the molar absorptivities of a standard for the species • εx= Axs / b[X]sεy= Ays / b[Y]s • However, we often do not know the concentrations. We can solve for this using excel • Using the equation Acalc = εxb[X]guess + εyb[Y]guess
The terms [X]guess and [Y]guess are inserted into the spreadsheet and the sum of the squares (Acalc – Am)2 set equal to them. Using the solver function to vary [X]guess and [Y]guess to minimize the sum of the squares, we can compute the most likely concentrations.
When spectra are well resolved, we use a matrix determination of the functions A’ = ε’xb[X] + ε’yb[Y] A” = ε”xb[X] + ε”yb[Y] in order to compute the concentrations of X and Y. • Often one absorbing species, X, will convert to another absorbing species, Y, which will result in a very distinct pattern in which the graphs cross at a point known as the Isosbestic point
Measuring an Equilibrium Constant: The Scatchard Plot • Equilibrium constants are measured by activities. For example, for the equilibrium P + X = PX, K= [PX]/[P][X] • If there were a series of solutions in which increments of X are added to a constnant amount of P, so that P0 is the total concentration of P, [P] = P0 -[PX]
Substituting this into the equilibrium expression, and rearranging terms, we get [PX]/[P] = K[P] = K(P0 - [PX]) • Using spetrophotometric absorbance to measure PX, we get A= εpx[PX] + εp[P] • Substituting [P] = P0 -[PX] again, we get A= εpx[PX] + εpP0 -εp[PX]
Since εpP0 is A0, A= [PX] (εpx-εp) + A0 [PX]=ΔA/Δε • So that ΔA/[X] = KΔεP0 - KΔA
Flow injection analysis • In flow injection analysis, a sample is injected into a moving liquid stream to which various reagents can be added. After a suitable time, the reacted sample reaches a detector, which is usually a spectrophotometric cell. Flow injection is widely used in medical and pharmaceutical analysis, water analysis, and industrial process control • A key feature of Flow injection analysis is rapid, repetitive analysis.
Immunoassays and Aptamers • Immunoassays, an important application of fluorescence employs antibodies to detect analytes. The analyte will bind to an antibody, and then a second antibody, which has an enzyme that results in either a colored or fluorescent product attached to it, binds to the analyte.
Time Resolved Immunoassays • The sensitivity of fluorescence immunoassays can be enhanced with time-resolved meausrements of luminescence from the lanthanide ion Eu3+. • A chelatin group binds the Eu3+ to the antibody; after completing all required steps, the pH is lowered and the Eu3+ is released as an ion in the presence of a soluble chelator, which attracts metal to the solution. Strong luminescence from the metal is easily detected
Aptamers • Aptamers are ~15-40 base pieces of DNA or RNA that strongly and selectively bind to a specific molecule. An aptamer for a desired target molecule is chosen from a pool of random DNA or RNA sequences by successive cyclings of binding to the target, removing unbound material, and replicating the bound nucleic acid. . This aptamer then behaves as a custom made, synthetic “antibody”.
Sensors based on Luminescent Quenching • Luminescence intensity is proportional to the concentration of the emitting species if concentrations are low enough. We can measure some analytes, such as O2, by their ability to quench the luminescence of another compound. • In a “molecular beacon,” fluorescent and quenching groups are built onto one molecule of DNA or RNA. When the beacon binds to complementary molecules of DNA or RNA, the fluorescent group separates from the quencher and the molecule becomes strongly fluorescent