Download
1 / 4
Download Presentation 
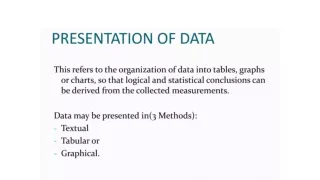
Presentation of Data
An Image/Link below is provided (as is) to download presentation
Download Policy: Content on the Website is provided to you AS IS for your information and personal use and may not be sold / licensed / shared on other websites without getting consent from its author.
Content is provided to you AS IS for your information and personal use only.
Download presentation by click this link.
While downloading, if for some reason you are not able to download a presentation, the publisher may have deleted the file from their server.
During download, if you can't get a presentation, the file might be deleted by the publisher.
E N D
Presentation Transcript
Bar Diagrams As the name suggests, when data is presented in form of bars or rectangles, it is termed to be a bar diagram.
Types of Bar Diagrams 1. Simple Bar Diagram 2. Multiple Bar Diagram 3. Sub-divided Bar Diagrams 4. Deviation Bar Diagrams
Pie or Circular Diagrams In addition to bar diagrams, pie diagrams are also widely used to pictorially represent data. In this, a circle is divided into various segments which are decided on the basis of percentages. Which means the circle is divided into sectors depending on various percentages.


More Related