Comparison of Asylum Applications to European Countries in 2000 and 2001
This data presentation compares the number of asylum applications to European countries in 2000 and 2001. The table and revised table show the applications received by each country, highlighting changes in the total number.


Comparison of Asylum Applications to European Countries in 2000 and 2001
E N D
Presentation Transcript
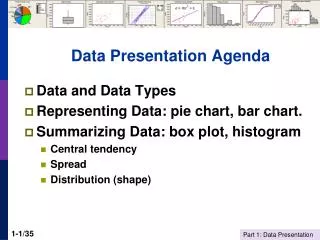
Data Presentation Frances A. Pfab Data Presentation 2007
Tables • Self-explanatory • Title • Headings • Source • Sample size • Base number if percentages shown Data Presentation 2007
Table Asylum applications to European Countries, 2000 & 2001 Country Applications Applications in 2000 in 2001 Austria 18,285 30,135 Belgium 48,650 27,960 Denmark 10,075 12,405 Finland 3,170 1,650 France 44,170 53,875 Germany 78,565 88,365 Greece 3,005 Not yet available Ireland 10,920 10,325 Italy 15,565 9,620 Luxembourg 585 690 Netherlands 43,895 32,580 Norway 10,840 14,780 Portugal 200 190 Spain 7,235 9,220 Sweden 16,285 23,500 Switzerland 17,660 20,770 UK 98,900 88,300 Total 428,005 424,365 Source: Home Office Data Presentation 2007
Table revision • Round to two significant figures • Order rows in decreasing order • Change order of columns if required • Use original (raw) data to calculate: • totals • percentages • Remove lines in table • Use white space to separate blocks of data Data Presentation 2007
Revised table Number of asylum applications to the EU, 2000 & 2001 Country Number of Applications 2001 2000 Germany 88,400 78,600 UK 88,300 98,900 France 53,900 44,200 Netherlds. 32,600 43,900 Austria 30,100 18,300 Belgium 28,000 48,700 Sweden 23,500 16,300 Switzerld. 20,800 17,700 Norway 14,800 10,800 Denmark 12,400 10,100 Ireland 10,300 10,900 Italy 9,600 15,600 Spain 9,200 7,200 Finland 1,700 3,200 Greece U/a 3,000 Luxembourg 700 600 Portugal 200 200 Total 424,400 428,000 Data Presentation 2007
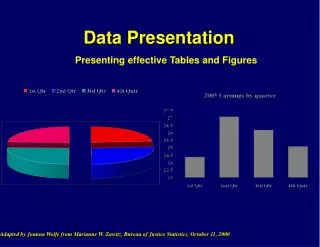
Charts • Self-explanatory • Title • Source • Legend • No more than two-dimensions • Appropriate scale Data Presentation 2007
Types of chart • Pie chart • Bar chart • Compound bar chart • Line graph • x-y graph Data Presentation 2007
Pie chart Data Presentation 2007
Bar chart Data Presentation 2007
Compound bar chart Data Presentation 2007
Line graph Data Presentation 2007
x-y graph Data Presentation 2007