Download
1 / 20
200 likes | 409 Views
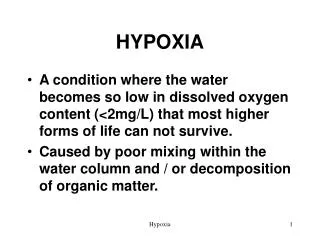
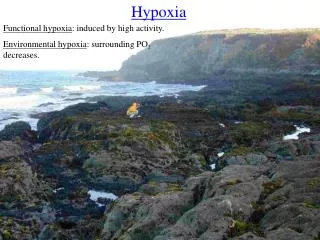
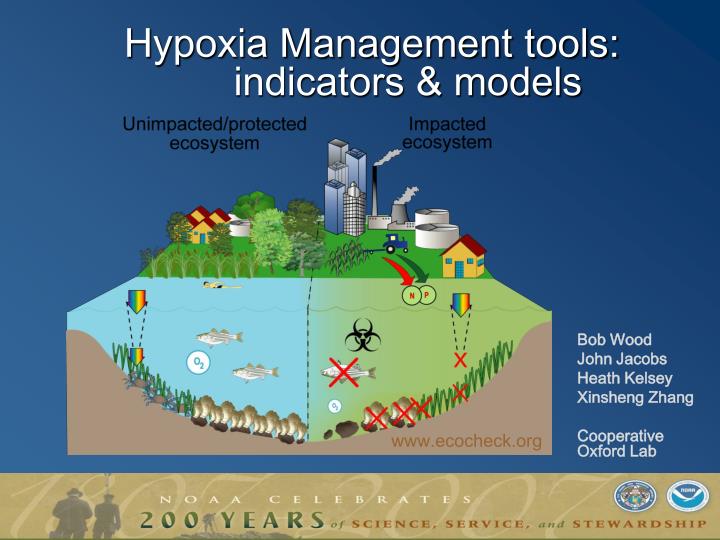
Hypoxia Management tools: indicators & models. Bob Wood John Jacobs Heath Kelsey Xinsheng Zhang Cooperative Oxford Lab . www.ecocheck.org. This workshop…what I learned. Hypoxia is a growing problem There are negative resource impacts associated with hypoxia

E N D
Hypoxia Management tools: indicators & models Bob Wood John Jacobs Heath Kelsey Xinsheng Zhang Cooperative Oxford Lab www.ecocheck.org
This workshop…what I learned • Hypoxia is a growing problem • There are negative resource impacts associated with hypoxia • Predictive models are the ultimate target • Our knowledge is still incomplete…
Intersecting objectives • NOAA’s place-based Integrated assessment approach • Chesapeake Bay chosen as a ‘proof-of-concept’ for Integrated Ecosystem Assessments (IEA) • Support commitments to Ecosystem-based fisheries management (NOAA; CBP; MD) • Deliver more with less (“actual actions”)
Ecosystem-based management • Support philosophical change in management approach • Institutional boundaries must be overcome • Constituents must be informed Link indicators to research, & modeling
Management tools: indicators (spatial), models, synthesis MD coastal bays “report card” www.ian.umces.edu
Linking Report card values to goods & services Pathogens & the Coastal Bay Ecosystem Health ‘report card’
Eutrophication/hypoxia in MD Coastal Bays Individual water quality samples Marine / Freshwater gradient Jacobs, Wood, et al. Dissolved Oxygen / Eutrophication gradient
. DO ------------------------------------- eutrophication
DO versus Vibrio p. abundance r2 = 0.28 p<0.0001
Bay Habitat Health ‘report card’anchor to ecosystem goods & service outcomes Coming soon to… www.ecocheck.org
Moving into Chesapeake Bay Built upon the Bay Program (in MD) WQ monitoring survey • Also being mapped: • Mycobacterium sp. • V.parahaemolyticus • Hematodinium
Linking watershed land use patterns to ecological stress Mattawoman St Marys %Forest Piscataway Piscataway Pocomoke Pocomoke Rhode Anacostia Anacostia Severn %Urban Northeast Northeast Patapsco Patapsco Choptank Choptank %Agriculture Back Back Wicomico Wicomico Magothy Chester Chester Elizabeth Elizabeth Sassafras BackCreek BackCreek Manokin Manokin Corsica Annemessex Annemessex Monie Bay Little Choptank %Wetland Honga
%Urban Land Use & dissolved oxygen Urban Land Use Ranking DO
%Agricultural Land Use & total dissolved nitrogen Agricultural Land Use Ranking TDN
A simple model: Bay Anchovy model Dissolved Oxygen Chesapeake Bay Program monitoring data Temperature Prey Response functions from literature: e.g., Brandt et al. 1992; Luo & Brandt 1993
Bay anchovy Habitat Suitability(growth rate potential) Zhang, Bahner, Wood, Houde, Annis, Harding
Model Performance VIMS VA Bay CPUE (MD DNR seine)
Consider punctuating research & model development with value added products • Outreach: • Agency managers • Decision makers • Constituents
Acknowlegements Many colleagues from partner institutions including … Center of Marine Biotechnology (U.MD) UMCES – HPL; CBL; IAN Chesapeake Bay Program SERC And others