Download
1 / 28
280 likes | 580 Views
Economic and Biophysical Models to Support Conservation Policy: Hypoxia and Water Quality in the Upper Mississippi River Basin. CARD Resources and Environmental Policy (REP) Division: Hongli Feng-Hennessy, Philip Gassman, Manoj Jha, Luba Kurkalova, Catherine Kling, and Silvia Secchi

E N D
Economic and Biophysical Models to Support Conservation Policy: Hypoxia and Water Quality in the Upper Mississippi River Basin CARD Resources and Environmental Policy (REP) Division: Hongli Feng-Hennessy, Philip Gassman, Manoj Jha, Luba Kurkalova, Catherine Kling, and Silvia Secchi November 2004
Hypoxia • Depleted oxygen creates zones incapable of supporting most life • 53% of U.S. estuaries experience hypoxia for at least part of the year
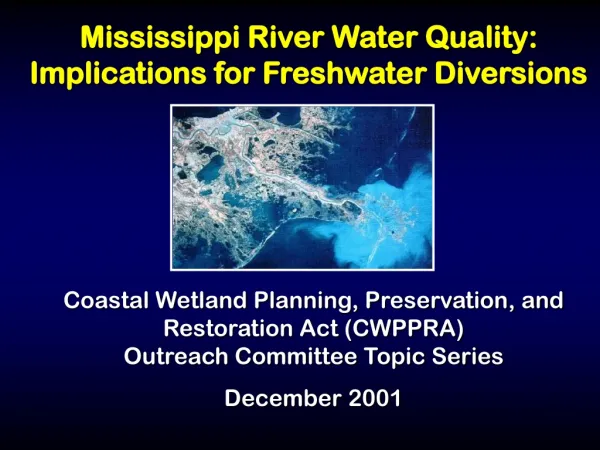
Gulf of Mexico Hypoxia • 7,000 square mile area in the Gulf of Mexico suffers from hypoxia (NOAA) • Cause linked to nutrient rich content of Mississippi river water flowing in to the Gulf
Local Water Quality Concerns • Impaired aquatic life use in 19% of Iowa's assessed rivers and 35% of assessed lakes; swimming use is impaired in 54% of river miles and 26% of assessed lakes and ponds • Sediment is the greatest pollutant, • Agriculture accounts for over 50% of impairments (EPA)
Some stats THE UMRB: • covers 189,000 square miles in seven states, • is dominated by agriculture: cropland and pasture together account for nearly 67% of the total area (NAS), • has more than 1200 stream segments and lakes on EPAs impaired waters list, highest concentrations of phosphorous found in the world (Downing), • is estimated to be the source of nearly 40% of the Mississippi nitrate load discharged in the 1980- 1986 (Goolsby et al.), • contains over 37,500 cropland NRI points
This Work • Estimate soil erosion benefits from conservation policy in large region (next step nutrients) • But, use “small” unit of analysis (110,000 NRI points in region) to preserve rich regional heterogeneity • in costs, • land and soil characteristics, • environmental changes • Study two fundamentally different land uses: • Land Retirement • Working land • Integrate two environmental models: • edge of field environmental benefits (EPIC) • and watershed effects (SWAT)
Two Major Conservation Programs: Land Retirement , Working Land Practices • Land retirement • Expensive • Lots of environmental benefits • Working land • Cheaper • Less environmental benefits
Modeling Approach • Pose Hypothetical Conservation Policy • Predict farmer choices between working land-conventional tillage, working land-conservation tillage, and land retirement • Economic model of working land • Returns to conventional tillage • Returns to conservation tillage • Economic model of land retirement • Predict environmental effects • Field level changes in erosion, phosphorous, nitrogen, carbon sequestration under each of the above three land uses • Watershed level changes in sediment and nutrients (phosphorous and nitrogen), under combinations of the above three land uses
Empirical Economic Model • Adoption model to estimate returns to conservation tillage • Specification, Estimation, and Prediction Samples 1. Specification search by 8-digit HUC (14 models) in 1st sample 2. Estimate on 2nd sample to obtain clean estimate of coefficients and standard errors 3. Use prediction sample to assess model fit out of sample • Cash rental rate as a function of yields to estimate opportunity cost of land retirement, vary by county and state • Data Sources: 1992 and 1997 NRI data (soil and tillage), Census of Agriculture (farmer characteristics), Climate data of NCDA, Conservation tillage data from CTIC, Cropping Practices Surveys (budgets), cash rental rates
Model Specification and Data (Continued) • Expected profit of conservation tillage ( x ) • Depends on soil characteristics, climate, and farmer characteristics • Expected profit of conventional tillage • County level estimates for each crop based on budget estimates • Adoption premium • Depends on historical (20 years) precipitation variability • Vary by crop, net returns, and farmer characteristics
*Diff : model where the difference between net returns from conservation tillage and conventional tillage is an independent variable. **net ret : model where the net returns from conventional tillage is the independent variable
LR costs: cropland cash rental rates • Cropland cash rental rate is a monotonic function of corn yield potential • Data: 1997, IA (ISU Extension) • Average cash rental rate by 3 land quality classes • Proportions of land in the 3 land quality classes • By county • EPIC prediction of corn yield potential in corn-soybean rotation • Estimated piece-wise-linear functions by county • Used them to estimate cash rental rate at every 1997 NRI point
Rental rate 1.2 rhigh rhigh rmed rlow 0.8 rlow Yield potential Low quality land Medium quality land High quality land Construction of rental rate function
Environmental Models • Two Models • Environmental Policy Integrated Climate (EPIC) Model • Soil and Water Assessment Tool (SWAT) • Similarities: both • simulate a high level of spatial details, • operate on a daily time-step • can perform long-term simulations of hundreds of years, and • can/have been used regional analyses and small-scale studies. • Key differences: • EPIC is field scale: no interactions between fields, aggregate environmental indicators are simple sum of field level effects • SWAT is watershed based: predicts changes in environmental quality at watershed outlets, highly nonlinear between practices, land characteristics, soil types, and water quality
Now the fun! Conservation Policy • CRP and CSP-type program • Subsidy rates differ by USGS 4-digit watersheds • Land retirement = pLR 20th percentile of LR costs in watershed • Conservation tillage subsidy=pWL median conservation tillage adoption costs
Predicted Program Costs: $1.4 Billion pWL= $32/acre (7,83) pLR=$72/acre (27,110)
Predicted Carbon Gains (EPIC): 9 million tons annually Average cost=$148/ton ($60, $430)
Predicted Percentage Transfer Payments at 4-digit Watershed Outlets Average transfer = 65%
Environmental Gains vs. Transfers Transfers Carbon
Predicted Reduction in Sediment at 8-digit Watershed Outlets
Sediment Predictions: SWAT vs EPIC EPIC SWAT
Final Remarks • Spatially rich model of large land area can be valuable tool • There is substantial heterogeneity in costs and environmental benefits across the UMRB • These differences have important efficiency and income distribution effects from conservation policies • The use of both an edge-of-field model (EPIC) and a watershed based model (SWAT) can increase our understanding of conservation policy efficiency as well as tradeoffs between equity and efficiency www.card.iastate.edu/waterquality