Download
1 / 32
1.38k likes | 3.19k Views
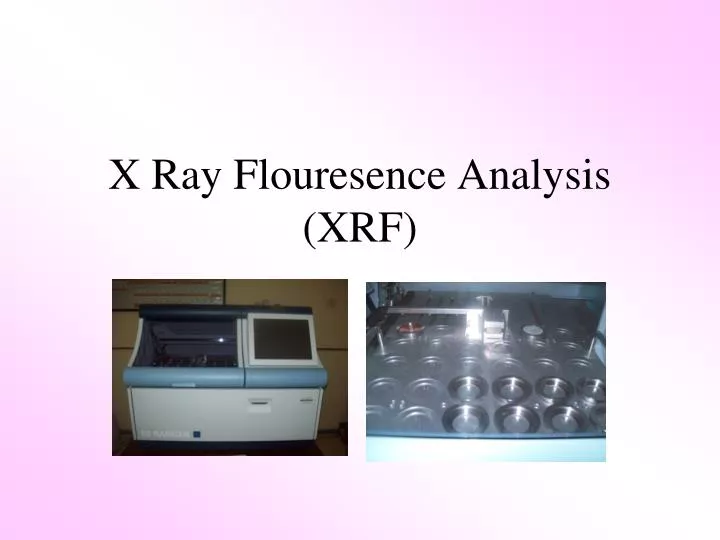
X Ray Flouresence Analysis (XRF). XRF. X-Ray Fluorescence is used to identify and measure the concentration of elements in a sample. XRF instrumental parameters. x-ray tube kv x-ray tube mA primary beam filters collimator masks. collimator crystal detector path. Sampel. METAL.

E N D
XRF X-Ray Fluorescence is used to identify and measure the concentration of elements in a sample
XRF instrumental parameters • x-ray tube kv • x-ray tube mA • primary beam filters • collimator masks • collimator • crystal • detector • path
Sampel METAL POWDER LIQUID XRD and XRF XRF only
XRF Working Concept In X-ray fluorescence spectroscopy, the process begins by exposing the sample to a source of x-rays. As these high energy photons strike the sample, they tend to knock electrons out of their orbits around the nuclei of the atoms that make up the sample. When this occurs, an electron from an outer orbit, or “shell”, of the atom will fall into the shell of the missing electron. Since outer shell electrons are more energetic than inner shell electrons, the relocated electron has an excess of energy that is expended as an x-ray fluorescence photon. This fluorescence is unique to the composition of the sample. The detector collects this spectrum and converts them to electrical impulses that are proportional to the energies of the various x-rays in the sample’s spectrum.
Factor of errors in Sample Preparation • Grain size and surface roughness • Uniformity of sample • Contamination through the sample • preparation
Uniformity of sample Sand molding Metallic Sample Metal molding Casting condition of the sample in the molding. X-ray intensities differ according to the molding method which comes In the measurement of light elements. Quenching casting which makes the metallic composition fine produces good results Sample polishing
Uniformity of sample Contamination during polishing As the contamination form the polishing belt to the sample, the re contamination from The material of the polishing belt and from the remaining trace elements of polished Sample. Contamination effect when carbon steel and Ni-Cr alloy polish after polishing stainless steel.
Powder Sample Different grinding condition cause variation in particle size distribution which leads to variation in X-Ray intensity. Grinding Condition
user benefits of wavelength dispersive XRF • versatile • accurate • reproducible • fast • non destructive
XRF is versatile • element range is Be to U atomic numbers (Z) of 4 to 92 • concentration range covers 0.1 ppm to 100 % • samples can be in the form of solids, liquids, powders or fragments
XRF is accurate • generally better than 1 % relative (i.e. 10% ± 0.1%) • accuracy is limited by calibration standards, sample preparation, sample matrix, sampling, instrumental errors & statistics
XRF is reproducible • generally within 0.1% relative • good reproducibility requires high quality mechanics, stable electronics and careful construction techniques
XRF is fast • counting times generally between 1 & 50 seconds for each element • semi-quant analysis of all matrix elements in 10 to 20 minutes • overnight un-attended operation
XRF is non-destructive • standards are permanent • measured samples can be stored and re-analysed at a later date • precious samples are not damaged
properties of x-rays the following four slides list some of the more important properties of x-rays that contribute to the nature of XRF analysis
XRF analytical envelope • elemental range • detection limits • analysis times • accuracy • reproducibility
elemental range • beryllium (4) to uranium (92) in solids • fluorine (9) to uranium (92) in liquids
range of elements in solid samples are shown in green (Be to U)
range of elements in liquid samples are shown in green (Na to U)
detection limits (LLD) • function of atomic number (Z) & the mix of elements within the sample (sample matrix) • < 1 ppm for high Z in a light matrix (e.g. Pb in petrol) • or > 10 ppm for low Z in a heavy matrix (Na in slag)
XRF applications summary • Na to U in all sample types • Be to U in solid samples • accuracy generally 0.1 to 1 % relative • reproducibility typically < 0.5% relative • typical LLD is normally 1 - 10 ppm (depends on element being measured and the sample matrix)
XRF errors the following section describes major source of errors in XRF analysis, and investigates how these errors can be minimized to achieve maximize accuracy
overview of XRF methodology good accuracy requires • careful sample preparation • fused beads for light elements • accurate standards • selection of optimum instrument parameters • collection of enough counts to avoid statistical errors
Methods of Analysis the following presentation describes the requirements for quantitative and semi-quantitative analysis
XRF analytical methods the atomic number (Z) of each of the elements to be determined will have an influence on the type of sample preparation to be used, and the quantitative or semi-quantitative method that will be the most suitable
XRF analytical methods • the quantitative method is the most accurate, but requires calibration standards • semi-quantitative method is less accurate, but does not require standards
overview of XRF methodology elements to be measured • low Z will require careful preparation • low Z may have lower accuracy • low Z may require fusion of powders • semi-quant does not measure the very light elements (Be to N)
overview of XRF methodology concentration ranges • as the concentration range for each element increased, accuracy generally decreases • large concentration ranges will require more standards
XRF applications summary • Na to U in all sample types • Be to U in solid samples • accuracy typically 0.1 to 1 % relative • typical LLD is between 1 - 10 ppm
Thank you for your attending! Workshop & Analysis Informations: Dr. Sayekti Wahyuningsih, M.Si Candra Purnawan, M.Sc Laboratorium MIPA Terpadu FMIPA Universitas Sebelas Maret Phone / fax : (0271) 663375