Download

1 / 44
440 likes | 577 Views
supply. amount of goods and services business firms are willing and able to provide at different prices. Law of Supply. the higher the price, the greater the quantity of the product a supplier will produce. business. a seller of goods or services. supply schedule. table of supply data.

E N D
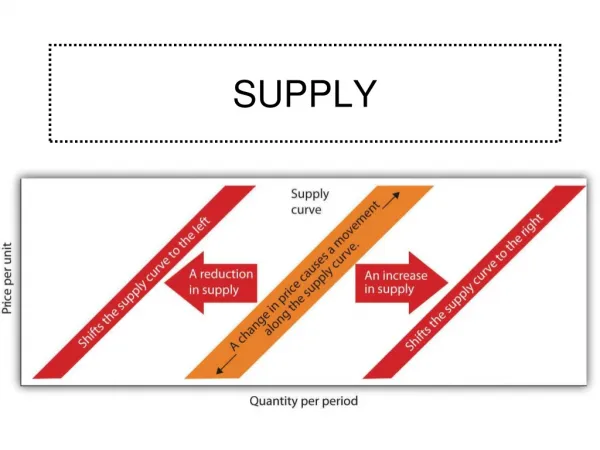
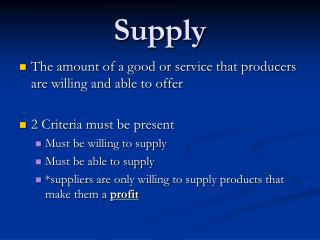
supply amount of goods and services business firms are willing and able to provide at different prices
Law of Supply the higher the price, the greater the quantity of the product a supplier will produce
business a seller of goods or services
supply schedule table of supply data
supply curve line-graph of supply schedule information
1.20 1.10 1.00 Supply Curve .90 .80 .70 .60 .50 .40 2000 1000 5000 3000 4000
$30,000 $25,000 Vertical graph $20,000 $15,000 $10,000 $5,000 2 1 3 4
$600 $500 Horizontal graph $400 $300 $200 $100 20 10 30 40 50 60
change in quantity supplied when a change in price buyers will pay causes a change in the number of goods supplied
.50 1.20 1.10 Change in Quantity Supplied 1.00 .90 .90 .80 .70 .60 .50 .40 2000 1000 5000 3000 4000
Change in Supply • decrease in supply • leftward shift • suppliers produce less at any given price
Change in Supply • increase in supply • rightward shift • suppliers produce moreat any given price
1.20 1.10 1.00 .90 .80 .70 .60 Decrease in Supply .50 .40 2000 1000 5000 3000 4000
1.20 Increase in Supply 1.10 1.00 .90 .80 .70 .60 .50 .40 2000 1000 5000 3000 4000
Supply Shift Factors • change in technology • change in production costs • change in price of related goods
Change in Technology • improves tools used to produce goods and services • improves production or reduces cost
Change in Production Costs • costs of natural resources, labor, and financial capital • changes in these costs affect supply
Change in Price of Related Goods • usually substitute goods • shift production to the more-profitable good
Market Equilibrium Point price at which consumers are willing to pull out of the market the exact quantity of product that suppliers are willing to push in
1.30 1.20 demand 1.10 1.00 .90 supply .80 .70 market equilibrium .60 .50 3000 1000 2000 7000 8000 4000 5000 6000
Economies of Scale • the more produced, the cheaper each product • supply more with hopes that demand increases
surplus an excess of unsold products
Surplus Costs • storage • security & insurance of the goods • spoilage of the goods • loss of income • interest costs of financing
Surplus Solutions • increase demand for the goods • decrease the supply • allow the price to fall to the equilibrium point
Surplus Solutions • increase demand for the goods • first and best solution for the supplier • produce a great quantity and charge a higher price • “demand solution”
1.35 1.30 1.20 1.10 1.00 demand2 .90 .80 demand1 supply .70 .60 3000 1000 2000 7000 8000 4000 5000 6000
Surplus Solutions • increase demand for the goods • increasing tastes & preferences • eliminate substitute goods • establish price floors
Surplus Solutions 2) decrease the supply • cut production • “supply solution” problems = competition reaction
1.35 1.30 supply2 1.20 1.10 1.00 .90 .80 supply1 .70 demand .60 3000 1000 2000 7000 8000 4000 5000 6000
Surplus Solutions increase demand decrease supply • demand solution • supply solution • shifts the demand curve • shifts the supply curve • favored by suppliers
Surplus Solutions 3) allow the price to fall to the market equilibrium point • the market does the work • supplier = gradually lowers price • buyer = purchases more at lower price • surplus gone; price stops falling
1.40 1.30 1.20 1.10 1.00 .90 .80 .70 .60 3000 1000 2000 7000 8000 4000 5000 6000
Surplus Solutions • increase demand for the goods • decrease the supply • allow the price to fall to the equilibrium point
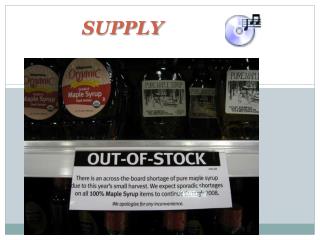
shortage • caused by the price of a good being held lower than its market equilibrium price • not enough of a good
loss leaders products deliberately sold at a loss to lure in customers
Price Ceilings • government restrictions on prices • prevent prices from rising to equilibrium value • always causes shortages
Shortage Solutions • decrease demand • increase supply • allow the price to rise to the market equilibrium point
Shortage Solutions • decrease demand • “demand solution” • by discouraging demand for a product
1.20 1.10 supply 1.00 .90 .80 demand2 .70 .60 demand1 .50 .40 3000 1000 2000 7000 8000 4000 5000 6000
Shortage Solutions 2) increase supply • “supply solution” • by: • managing supply • improving technology • boosting productivity
1.10 1.00 supply1 .90 .80 demand .70 .60 .50 supply2 .40 .30 3000 1000 2000 7000 8000 4000 5000 6000
Shortage Solutions decrease demand increase supply • demand solution • supply solution • shifts demand curve • shifts supply curve • dangerous to suppliers • focus on technology or production
Shortage Solutions 3) allow the price to rise to the market equilibrium point • not imposing price ceilings • benefits: • encourages conservation and discourages wastefulness • motivates entrepreneurs to enter the market
1.10 1.00 supply .90 .80 demand .70 .60 .50 .40 .30 3000 1000 2000 7000 8000 4000 5000 6000