Download
1 / 8
80 likes | 207 Views
Supply. Supply Function Change in Supply and Change in Quantity Supplied. Supply Function. The supply function can also be expressed in symbols. QS x = f (P x , P r, T, S i , P i , F, E, X) Here: QS x = Quantity supplied of commodity x by the producers f = Function of

E N D
Supply Supply Function Change in Supply and Change in Quantity Supplied
Supply Function Thesupply function can also be expressed in symbols. QSx = f (Px, Pr, T, Si, Pi , F, E, X) Here: QSx = Quantity supplied of commodity x by the producers f = Function of Px = Price of commodity x Pr = Price of related goods T = Technology. S = Supplies of inputs. Pi= Price of inputs F = No of firms E = Future Price Expectations. X = Taxes/Subsidies.
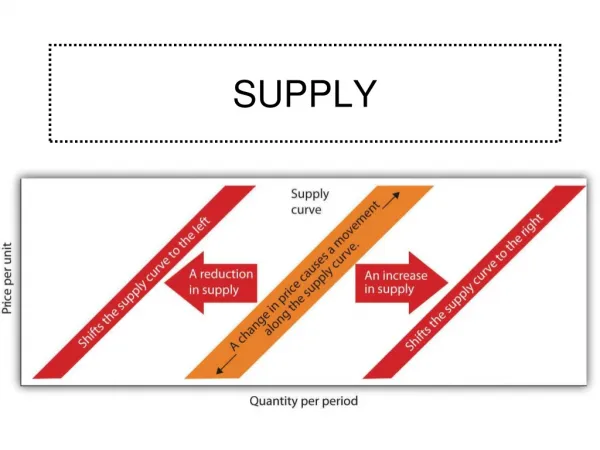
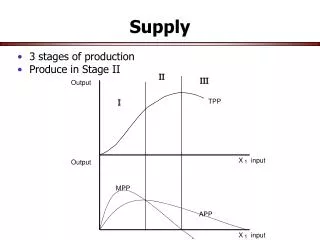
Change in Quantity Supplied • A change in the quantity supplied is caused only by a change in the price of the good in question. • Change in quantity supplied causes movement along the supply curve. • Causes Extension or Contraction of Quantity Supplied. • The supply curve stays constant because it is defined by the entire relationship between price and quantity.
In this graph: S in the supply curve Initial supply was at a and there was change in quantity supplied with change in price. This is Movement along the supply curve
In this graph:SS in the supply curveThe increase in QS from a to b due to Increase in price is called Expansion of Quantity supplied.The Decrease in QS from b to a due to fall in price is called Contraction of Quantity Supplied
Change in Supply • A change in supply occurs only when the supply curve shifts (Causesshifts in supply curve) • Caused by change in factors other then price. • Causes increase or decrease in Supply. • A change in supply (caused by a change in a determinant other than a good's own price) shifts the supply curve as price and quantity relationship is altered.
In this graph: S is the initial supply curve There was change in Supply due to factors other then price. Factors other then price cause Shift in the supply curve.
In this graph:Upward shift in supply curve causes decrease in Supply. In this graph:Downward shift in supply curve causes increase in Supply.