Download
1 / 33
330 likes | 479 Views
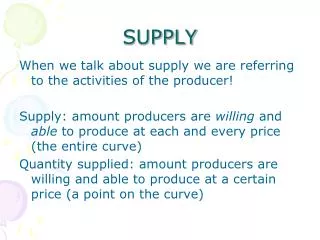
Supply. Supply. Individuals control the factors of production – inputs, or resources, necessary to produce goods. Individuals supply factors of production to intermediaries or firms. Supply. The analysis of the supply of produced goods has two parts:.

E N D
Supply • Individuals control the factors of production – inputs, or resources, necessary to produce goods. • Individuals supply factors of production to intermediaries or firms.
Supply • The analysis of the supply of produced goods has two parts: • An analysis of the supply of the factors of production to households and firms. • An analysis of why firms transform those factors of production into usable goods and services.
The Law of Supply • There is a direct relationship between price and quantity supplied. • Quantity supplied rises as price rises, other things constant. • Quantity supplied falls as price falls, other things constant.
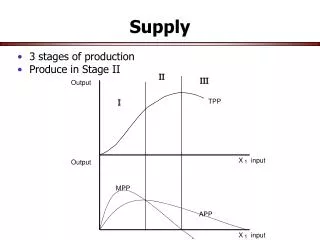
Law of Supply • Law of Supply • As the price of a product rises, producers will be willing to supply more. • The height of the supply curve at any quantity shows the minimum price necessary to induce producers to supplythat next unit to market. • The height of the supply curve at any quantity also shows the opportunity cost ofproducing the next unitof the good.
The Law of Supply • The law of supply is accounted for by two factors: • When prices rise, firms substitute production of one good for another. • Assuming firms’ costs are constant, a higher price means higher profits.
The Supply Curve • The supply curve is the graphic representation of the law of supply. • The supply curve slopes upward to the right. • The slope tells us that the quantity supplied varies directly – in the same direction – with the price.
S Price (per unit) 0 Quantity supplied (per unit of time) A Sample Supply Curve A PA QA
Shifts in Supply Versus Movements Along a Supply Curve • Supply refers to a schedule of quantities a seller is willing to sell per unit of time at various prices, other things constant.
Shifts in Supply Versus Movements Along a Supply Curve • Quantity supplied refers to a specific amount that will be supplied at a specific price.
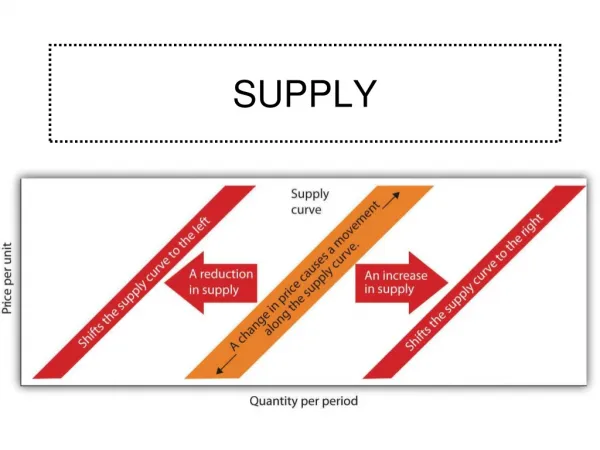
Shifts in Supply Versus Movements Along a Supply Curve • Changes in price causes changes in quantity supplied represented by a movement along a supply curve.
Shifts in Supply Versus Movements Along a Supply Curve • A movement along a supply curve – the graphic representation of the effect of a change in price on the quantity supplied.
Shifts in Supply Versus Movements Along a Supply Curve • If the amount supplied is affected by anything other than a change in price, there will be a shift in supply.
Shifts in Supply Versus Movements Along a Supply Curve • Shift in supply – the graphic representation of the effect of a change in a factor other than price on supply.
B Change in quantity supplied (a movement along the curve) A Change in Quantity Supplied S0 Price (per unit) $15 1,250 1,500 Quantity supplied (per unit of time)
S1 Price (per unit) A B Shift in Supply (a shift of the curve) Quantity supplied (per unit of time) Shift in Supply S0 $15 1,250 1,500
Shift Factors of Supply • Other factors besides price affect how much will be supplied: • Prices of inputs used in the production of a good. • Technology. • Suppliers’ expectations. • Taxes and subsidies.
Price of Inputs (Resource Prices) • When costs go up, profits go down, so that the incentive to supply also goes down.
Technology • Advances in technology reduce the number of inputs needed to produce a given supply of goods. • Costs go down, profits go up, leading to increased supply.
Expectations • If suppliers expect prices to rise in the future, they may store today's supply to reap higher profits later.
Number of Suppliers • As more people decide to supply a good the market supply increases (Rightward Shift).
Individual and Market Supply Curves • The market supply curve is derived by horizontally adding the individual supply curves of each supplier.
(1) (2) (3) (4) (5) Quantities Price Ann's Barry's Charlie's Market Supplied (per DVD) Supply Supply Supply Supply A B C D E F G H I $0.00 0.50 1.00 1.50 2.00 2.50 3.00 3.50 4.00 0 1 2 3 4 5 6 7 8 0 0 1 2 3 4 5 5 5 0 0 0 0 0 0 0 2 2 0 1 3 5 7 9 11 14 15 From Individual Supplies to a Market Supply
Charlie Barry Ann Market Supply I H G F E D C CA B A From Individual Supplies to a Market Supply $4.00 3.50 3.00 2.50 Price per DVD 2.00 1.50 1.00 0.50 0 1 2 3 4 5 6 7 8 9 10 11 12 13 14 15 16 Quantity of DVDs supplied (per week)
Price of Related Goods or Services • The opportunity cost of producing and selling any good is the forgone opportunity to produce another good. • If the price of alternate good changes then the opportunity cost of producing changes too! • Example Mc Don selling Hamburgers vs. Salads.
Taxes and Subsidies • When taxes go up, costs go up, and profits go down, leading suppliers to reduce output. • When government subsidies go up, costs go down, and profits go up, leading suppliers to increase output.