Download

1 / 19
200 likes | 399 Views
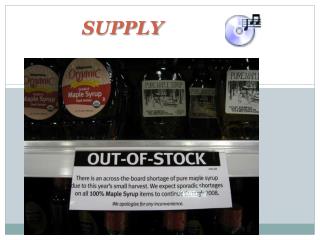
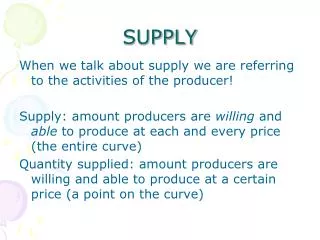
SUPPLY. Chapter 5. SUPPLY IS. Supply is NOT how much of a good is sitting on the grocery store shelves --- instead it is how much producers are willing to supply of a given product at all possible prices. SUPPLY = THE AMOUNT OF PRODUCT OFFERED FOR SALE AT ALL POSSIBLE MARKET PRICES

E N D
SUPPLY Chapter 5
SUPPLY IS • Supply is NOT how much of a good is sitting on the grocery store shelves --- instead it is how much producers are willing to supply of a given product at all possible prices. • SUPPLY = THE AMOUNT OF PRODUCT OFFERED FOR SALE AT ALL POSSIBLE MARKET PRICES • WHAT IS THE LAW OF SUPPLY? • The higher the price, the more suppliers are willing to produce…and vice versa • Individual firms change levels of production in accordance with price – the search for profit drives a producer’s decision to make more or less of a product
Supply Schedule Price per Unit $ Quantity Supplied 20 160 14 100 10 80 7 60 5 40 4 20 2 0 LAW OF SUPPLY As increasingly lower prices are offered, suppliers are LESS willing to supply goods As increasingly higher prices are offered, suppliers are MOREwilling to supply goods Price & quantity move in the same direction for supply. How does this differ from demand?
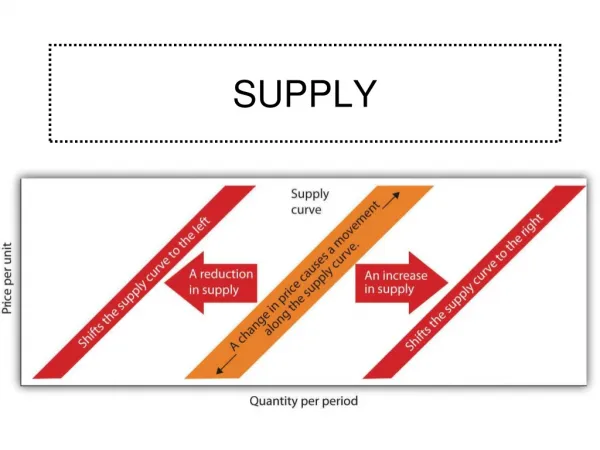
SUPPLYCURVES • Supply curves are upward sloping – from lower left to upper right • Supply Curves reflect how the quantity that a producer will make rises as the price in the marketplace rises.
SUPPLY CURVE A CHANGE IN QUANTITY SUPPLIED is the amount offered for sale purely in response to a CHANGE IN PRICE. 24 s 22 20 18 Price per Unit $ 16 14 12 10 8 6 4 s 2 20 40 60 80 100 120 140 160 180 Quantity Supplied
ELASTIC a small increase OR decrease in price leads to a large change in quantity supplied supply in the long term will be more elastic – why? ELASTICITY OF SUPPLY(how quantity supplied by producers responds to changes in price) 3 POSSIBILITIES:
UNITARY ELASTIC • % Price Changes = % change in quantity supplied • e.g., doubling in price = doubling in quantity supplied INELASTIC a change in price causes little change in the quantity supplied Supply in the short-term will be inelastic – why?
DETERMININGSUPPLY ELASTICITY Determined solely by this question: How quickly and easily can we make or find more? • The only thing that determines elasticity of supply is production considerations. • If a firm can respond & adjust quickly = elastic • If production is complex and requires lots of advance planning = inelastic • Supply elasticity differs from demand elasticity in that the number of substitutes has no effect at all on supply
DETERMINING SUPPLY ELASTICITY Elastic or Inelastic? Oil and gas Electrical energy Milk Medical care Candy Oceanfront property
CHANGE IN SUPPLY A change in supply is when suppliers offer different amounts of products for sale at all possible prices in the market. The entire supply curve shifts. BUT, what causes the change? Productivity (motivated vs. unmotivated) Cost of Inputs (raw materials, machinery, labor, etc.) Expectations Government regulation
Why doessupply change? Number of sellers (Which way does supply curve shift? Taxes and Subsidies (Which causes increase?) (Which causes decrease?) Technology (Which way will supply curve shift?)
KNOW THE DIFFERENCE!! Does the graph below represent a “change in quantity supplied” or a “change in supply?” 24 s 22 20 18 Price per Unit $ 16 p2 14 12 10 p1 8 6 4 s q1 q2 2 20 40 60 80 100 120 140 160 180 Quantity Supplied If the only variable is a change in price, it’s a …. Change in Quantity Supplied!
Change in Supply s2 24 s 22 20 s1 18 Price per Unit $ 16 14 12 10 8 s2 6 4 s s1 2 20 40 60 80 100 120 140 160 180 Quantity Supplied Means there is a new supply provided at each and every price…. a totally new supply curve that has shifted either right or left.
Draw theoretical curves to show the following: • The cost of sheet metal has increased • Workers have received extra training • A better machine is installed and running • Many sellers have left the business • The government keeps increasing the tax on our product • Our product is red hot • The government is going to relax the clean air laws
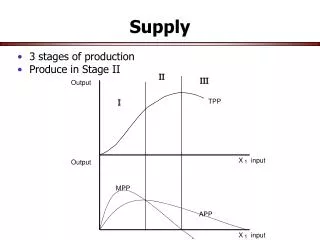
Costs of ProductionHow does a firm decide how much to produce? • Determining output will have a direct relation with the factors of production……such as labor • Generally, as you add more workers, what would you expect to happen to output? • Increase – why? • Workers can specialize; division of labor; etc. • BUT, what ultimately happens if too many workers are added? • Producers need to determine the marginal product of labor, i.e., the change in output when an additional worker is hired
Stages of Production • THE THREE STAGES OF PRODUCTION • Increasing marginal returns • Adding additional worker(s) increases marginal product of labor • Diminishing marginal returns • Continuing to add additional worker(s) starts to decrease the marginal product of labor • Negative returns • WHY?
EFFECT OF PRODUCTION COSTS ON SUPPLY: • FIXED EXPENSES/COSTSare those that have to be paid regardless of the amount of production • Executive salaries, rent, taxes, depreciation, capital goods • VARIABLE EXPENSES/COSTSare those that will depend on the amount of business being done • Labor and raw materials • BREAK-EVEN POINT • Total amount producer needs to sell in order to cover production costs • “Total costs of Production” = Fixed & Variable Expenses combined
FIXED OR VARIABLE COSTS? • An advertisement for the store that runs in the local newspaper every week? • FIXED COST • 5 new workers hired to help out in the holiday season • VARIABLE COST – THEIR HOURS WILL NOT ALWAYS BE THE SAME AMOUNT • A store’s electrical bill? • VARIABLE COST • Cost of pizza dough for a pizzaRIA parlor? • VARIABLE COST