Download
1 / 18
180 likes | 303 Views
Supply. It is like, where the companies make stuff and junk to fill demand. . Price As price increases…. Supply Quantity supplied increases. Price As price falls…. Supply Quantity supplied falls. The Law of supply . Suppliers will offer more of a good at a higher price. .

E N D
Supply It is like, where the companies make stuff and junk to fill demand.
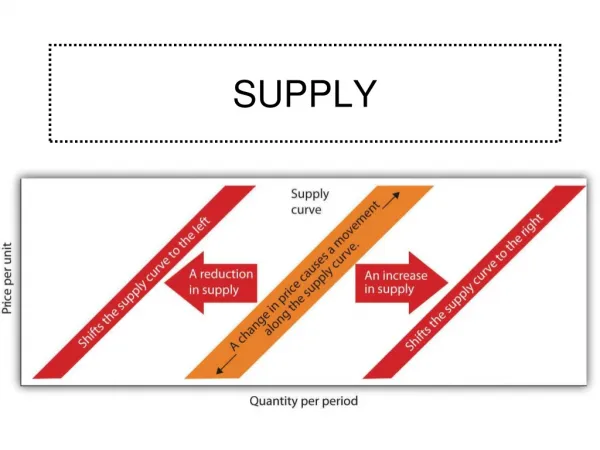
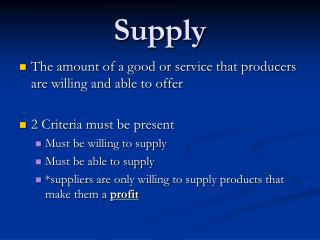
Price As price increases… Supply Quantity supplied increases Price As price falls… Supply Quantity supplied falls The Law of supply • Suppliers will offer more of a good at a higher price.
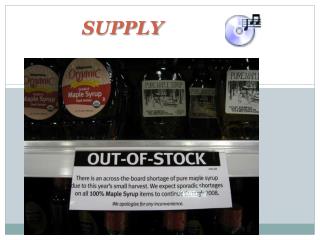
Supply • The amount of product producers are willing and able to sell. • Quantity Supplied: how much of a good is offered for sale at a specific price.
Market supply schedule • A market supply schedule is a chart that lists how much of a good all suppliers will offer at different prices.
Market Supply Schedule Price per slice of pizza Slices supplied per day $.50 1,000 $1.00 1,500 $1.50 2,000 $2.00 2,500 $2.50 3,000 $3.00 3,500 Supply Schedules A market supply schedule is a chart that lists how much of a good all suppliers will offer at different prices.
Market Supply Curve 3.00 2.50 2.00 1.50 1.00 .50 0 Supply Price (in dollars) 0 500 1000 1500 2000 2500 3000 3500 Output (slices per day) Supply Curves • A market supply curve is a graph of the quantity supplied of a good by all suppliers at different prices.
Elasticity of supply • A measure of the way quantity supplied reacts to a change in price. • Inelastic • When supply is not very responsive to change in price. • Elastic: • Supply is very sensitive to changes in price.
What affects elasticity of supply, you ask? • Time: • In the short run, a firm cannot easily change its output level, so supply is inelastic. • In the long run, firms are more flexible, so supply can become more elastic.
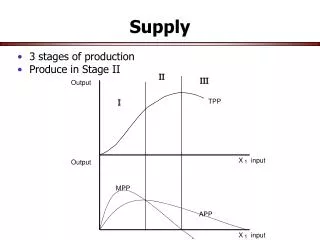
A Firm’s Labor Decisions: Figure 5.6 • Business owners have to consider how the number of workers they hire will affect their total production. • The marginal product of labor is the change in output from hiring one additional unit of labor, or worker.
Increasing, Diminishing, and Negative Marginal Returns Increasing marginal returns occur when marginal production levels increase with new investment. 8 7 6 5 4 3 2 1 0 –1 –2 –3 Increasing marginal returns Diminishing marginal returns Diminishing marginal returns occur when marginal production levels decrease with new investment. Marginal Product of labor (beanbags per hour) Negative marginal returns Negative marginal returns occur when the marginal product of labor becomes negative. 8 9 1 2 3 4 5 6 7 Labor(number of workers) Marginal Returns Figure 5.7
Production costs Figure 5.8 • Fixed cost:cost that does not change, regardless of how much of a good is produced. • Examples: rent and salaries • Variable costs: are costs that rise or fall depending on how much is produced. • Examples: costs of raw materials, some labor costs. • The total cost:equals fixed costs plus variable costs. • FIXED COST + VARIABLE COST = TOTAL COST • The marginal cost: is the cost of producing one more unit of a good.
Production Costs Beanbags (per hour) Fixed cost Variable cost Total cost (fixed cost + variable cost) Marginal cost Marginal revenue (market price) Total revenue Profit(total revenue – total cost) 0 1 2 3 4 $36 36 36 36 36 $0 8 12 15 20 $36 44 48 51 56 — $8 4 3 5 $24 24 24 24 24 $0 24 48 72 96 $ –36 –20 0 21 40 5 6 7 8 36 36 36 36 27 36 48 63 63 72 84 99 7 9 12 15 24 24 24 24 120 144 168 192 57 72 84 93 9 10 11 12 36 36 36 36 82 106 136 173 118 142 172 209 19 24 30 37 24 24 24 24 216 240 264 288 98 98 92 79 Setting Output Figure 5.9 • Marginal revenue is the additional income from selling one more unit of a good. It is usually equal to price. • To determine the best level of output, firms determine the output level at which marginal revenue is equal to marginal cost.
Input costs and supply • If the price of resources or labor • (input costs), changes, this will affect supply. • Input costs go up, firms marginal costs also go up. • Input costs decrease, marginal cost decreases.
The last thing before we are done. The determinants of supply
Determinants of supply • Subsidies: government payment that supports a business. • Causes supply to increase. • Taxes: an increase in taxes causes a decrease in supply. A decrease in taxes increases supply. • Excise tax: a tax on the production or sale of a good.
Determinants of supply • Regulation: occurs when the government steps into a market to affect the price, quantity, or quality of a good. • Regulation raises cost of goods. • Input Costs: If the prices of raw materials, labor, etc. goes up, Cost goes up.
Other Factors Influencing Supply • The Global Economy • The supply of imported goods and services has an impact on the supply of the same goods and services here. • Government import restrictions will cause a decrease in the supply of restricted goods. • Future Expectations of Prices • Expectations of higher prices will reduce supply now and increase supply later. Expectations of lower prices will have the opposite effect. • Number of Suppliers • If more firms enter a market, the market supply of the good will rise. If firms leave the market, supply will decrease.