Download
1 / 36
360 likes | 471 Views
FAST VELOCITY ANALYSIS BY PRESTACK WAVEPATH MIGRATION. H. Sun. Geology and Geophysics Department University of Utah. SEG 3-D Salt Data. KM. WM. CPU: 1. CPU: 1/33. Sub WM. Model. CPU: 1/170. Horizontal Slice (Depth=1.4 km). 3-D West Texas Data. KM ( CPU=1 ).

E N D
FAST VELOCITY ANALYSIS BY PRESTACK WAVEPATH MIGRATION H. Sun Geology and Geophysics Department University of Utah
SEG 3-D Salt Data KM WM CPU: 1 CPU: 1/33 Sub WM Model CPU: 1/170 Horizontal Slice (Depth=1.4 km)
3-D West Texas Data KM (CPU=1) WM (CPU=1/14) Sub WM (CPU=1/50) 0.8 Depth (km) 3.8 Inline Slice (Offset: 0.4~4.5 km)
A 2-D KM of a Single Event A R S
A 2-D WM of a Single Event A R S
Outline • Objectives • Migration Velocity Analysis • 2-D Synthetic Data • 2-D Marine Field Data • Conclusions
Objectives • Can WMVA effectively improve the • migration velocity? • Whether the WMVA updated velocity • differs much from the KMVA updated • velocity? • Can WMVA be much faster than • KMVA?
Outline • Objectives • Migration Velocity Analysis • 2-D Synthetic Data • 2-D Marine Field Data • Conclusions
Initial Velocity COG Migration MVA Flow Chart Nemeth 1995 Stacked Image & CIGs Pick Layer Boundaries Pick Depth Residuals in CIGs Depth Residual --> Time Residual Ray Tracing Updating: s=s+ds
Outline • Objectives • Migration Velocity Analysis • 2-D Synthetic Data • 2-D Marine Field Data • Conclusions
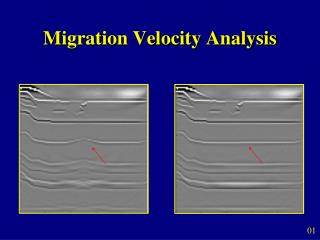
Correct Velocity 0 Depth (m) 40 KM Image CIG 0 Depth (m) 40 Distance (m) 0 50 0 Offset (m) 50
1st Iteration 7th Iteration KMVA (1st Layer) KM KM CIG CIG V V
1st Iteration 7th Iteration KMVA (4th Layer) KM KM CIG CIG V V
1st Iteration 7th Iteration WMVA (1st Layer) WM WM CIG CIG V V
1st Iteration 6th Iteration WMVA (4th Layer) WM WM CIG CIG V V
Correct Velocity 0 Depth (m) 40 KMVA (CPU=2) WMVA (CPU=1) 0 Depth (m) 40 Distance (m) 0 50 0 50 Distance (m)
Outline • Objectives • Migration Velocity Analysis • 2-D Synthetic Data • 2-D Marine Field Data • Conclusions
Initial Migration Velocity Horizontal Distance (km) 0 18 0 2.1 Depth (km) (km /s) 1.5 1.5
T B KM Image with Initial Velocity Horizontal Distance (km) 0 18 0 Depth (km) 1.5
KMVA CIGs with Initial Velocity 0 Depth (km) 1.2 1.5
KM Image with Initial Velocity 0 18 km 0 Depth (km) 1.5 KMVA Velocity Changes in the 1st Iteration 0 50 Depth (km) (m /s) 0 1.5
KM Image with Initial Velocity 0 18 km 0 Depth (km) 1.5 KM Image with Updated Velocity 0 Depth (km) 1.5
KM Image with Initial Velocity 2 km 9 km 1070 Depth (m) 1260 KM Image with Updated Velocity 1070 Depth (m) 1260
KMVA CIGs with Initial Velocity KMVA CIGs with Updated Velocity 0 Depth (km) 1.5
T T B B KM Image with Initial Velocity 0 18 km 0 Depth (km) 1.5 WM Image with Initial Velocity 0 Depth (km) 1.5
WMVA CIGs with Initial Velocity 0 Depth (km) 1.2 1.5
KMVA Velocity Changes in the 1st Iteration (CPU=6) 0 18 km 0 50 Depth (km) (m /s) 0 1.5 WMVA Velocity Changes in the 1st Iteration (CPU=1) 0 50 Depth (km) (m /s) 0 1.5
WM Image with Initial Velocity 0 18 km 0 Depth (km) 1.5 WM Image with Updated Velocity 0 Depth (km) 1.5
WM Image with Initial Velocity 2 km 9 km 1070 Depth (m) 1260 WM Image with Updated Velocity 1070 Depth (m) 1260
WMVA CIGs with Initial Velocity WMVA CIGs with Updated Velocity 0 Depth (km) 1.5
KM Image with KMVA Updated Velocity 0 18 km 0 Depth (km) 1.5 KM Image with WMVA Updated Velocity 0 Depth (km) 1.5
KM Image with Initial Velocity 2 km 9 km 1070 Depth (m) 1260 KM Image with KMVAUpdated Velocity 1070 Depth (m) 1260 KM Image with WMVAUpdated Velocity 1070 Depth (m) 1260
Outline • Objectives • Migration Velocity Analysis • 2-D Synthetic Data • 2-D Marine Field Data • Conclusions
Conclusions • Can WMVA effectively improve the • migration velocity? Yes • Whether the WMVA updated velocity • differs much from the KMVA updated • velocity? No
Conclusions • Can WMVA be much faster than • KMVA? Yes • Synthetic data: twice as fast as KMVA • Field data : 6 times faster than KMVA • How about 3-D data? • Could be more than 10 times faster
Acknowledgements I thank UTAM sponsors for their financial support