Download

1 / 40
450 likes | 600 Views
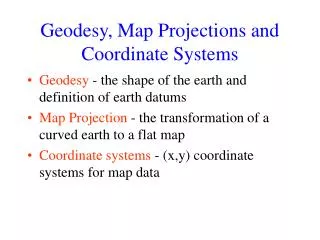
Ellipsoid and Datum, Projection, Coordinate system, and Map Scale. Lectures 4 and 5 Feb. 2 and 4, 2004. 1. Earth Shape Models. Flat earth models are still used for plane surveying, over distances short enough so that earth curvature is insignificant (less than 10 km).

E N D
Ellipsoid and Datum, Projection, Coordinate system, and Map Scale Lectures 4 and 5 Feb. 2 and 4, 2004
1 Earth Shape Models • Flat earth models are still used for plane surveying, over distances short enough so that earth curvature is insignificant (less than 10 km). • Spherical earth models (Earth centered model) represent the shape of the earth with a sphere of a specified radius. Spherical earth models are often used for short range navigation (VOR-DME) and for global distance approximations. Spherical models fail to model the actual shape of the earth. • Ellipsoidal earth models are required for accurate range and bearing calculations over long distances. Ellipsoidal models define an ellipsoid with an equatorial radius and a polar radius. The best of these models can represent the shape of the earth over the smoothed, averaged sea-surface to within about one-hundred meters. • Although the earth is an ellipsoid, its major and minor axes do not vary greatly. In fact, its shape is so close to a sphere that it is often called a spheroid rather than an ellipsoid. But sometimes, the spheroid confused people. SO I often call ellipsoid.
Globe • Spherical Earth’s surface -radius 6371 km • Meridians (lines of longitude) - passing through Greenwich, England as prime meridian or 0º longitude. • Parallels (lines of latitude) - using equator as 0º latitude. • degrees-minutes-seconds (DMS), • decimal degrees (DD) True direction, shape, distance, and area
Spherical and Ellipsoidal Earth Earth Centered X/Y/Z Geodetic Lat/Lon/Height
Earth Surface: Ellipsoid, Geoid, Topo • The reference ellipsoid surface (a map of average sea level). • The reference geoid surface (a mean sea level surface). • The real surface of the Earth (the ground) also called the topographic surface.
THE GEOID and ELLIPSOID SOURCE: National Geodetic Survey http://www.ngs.noaa.gov/GEOID/geoid_def.html
Geodetic Datum • Geodetic datum defines the size and shape of the ellipsoid earth and the origin (or position) and orientation (or direction) with respect to the Earth. • the direction of the minor axis of the ellipsoid. This is classically defined as being parallel to the mean spin axis of the earth • the position of its centre, either implied by adopting a geodetic latitude and longitude (Φ, λ) and geoid / ellipsoid separation (N) at one, or more points (datum stations), or in absolute terms with reference to the Earth centre of mass; and • the zero of longitude (conventionally the Greenwich Meridian). • True geodetic datums were employed only after the late 1700s when measurements showed that the earth was ellipsoidalin shape. The science of geodesy.
SelectedEllipsoids and Datums Source: http://maic.jmu.edu/sic/standards/datum.htm
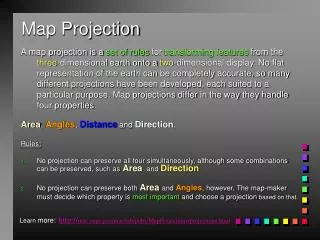
2 Basics of Map Projections • A map projection is a mathematical model for conversion of locations from a three-dimensional earth surface to a two-dimensional map representation. This conversion necessarily distorts some aspect of the earth's surface, such as area, shape, distance, or direction. • Every projection has its own set of advantages and disadvantages. There is no "best" projection. Some distortions of conformality (shape), scale, distance, direction, and area always result from this processes. Some projections minimize distortions in some of these properties at the expense of maximizing errors in others. Some projection are attempts to only moderately distort all of these properties • The mapmaker must select the one best suited to the needs, reducing distortion of the most important features. • Mapmakers and mathematicians have devised almost limitless ways to project the image of the globe onto a flat surface (paper).
Classes of Map projections Physical models: • Cylindrical projections (cylinder) - Tangent case - Secant case • Conic Projections (cone) - Tangent case - Secant case • Azimuthal or planar projections (plane) - Tangent case - Secant case Distortion properties: • Conformal (preserves local angles and shape) • Equal area or equivalent (area) • Equidistant (scale along a center line) • Azimuthal (directions)
Cylindrical Transverse Cylindrical Oblique Cylindrical Secant Cylindrical Conical Secant Conical Planar Secant Planar
Dynamic View of Projections • http://www.cnr.colostate.edu/class_info/nr502/lg1/map_projections/form_case_aspect.html • http://www.cnr.colostate.edu/class_info/nr502/lg1/map_projections/developable_surfaces.html
Common Used Projections • Mercator Projection (1569) - Directions are true along straight line of any two points, Distances are true only along equator, and reasonable correct within 15 of equator, in secant model, distance along two parallels are correct in scale instead of the Equator. Areas and shapes of large area are distorted. Distortion increases away from Equator and is extreme in polar regions. However, map is conformal in that angles and shapes within any small area is essentially true. - Used for navigation or maps of equatorial regions. • Transverse Mercator Projection (Lambert 1772) - Distances are true only along the central meridian selected by the mapmaker or else along two lines parallel to it, but all distances, directions, shapes, and areas are reasonably accurate within 15° of the central meridian. Distortion of distances, directions, and size of areas increases rapidly outside the 15° band. Because the map is conformal, however, shapes and angles within any small area (such as that shown by a USGS topographic map) are essentially true. - Used for many USGS 1:24,000 to 1:250,000 map
Common Used Projections • Albers Equal-Area Conic Projection (1805) - All areas on the map are proportional to the same areas on the Earth. Directions are reasonably accurate in limited regions. Distances are true on both standard parallels. Maximum scale error is 1 1/4% on map of conterminous States with standard parallels of 29 1/2°N and 45 1/2°N. Scaletrue only along standard parallels - Used for maps showing the conterminous United Stated. • Lambert Conformal Conic Projection (1772) - Distances trueonly along standard parallels; reasonably accurate elsewhere in limited regions. Directions reasonably accurate. Distortion of shapes and areas minimal at, but increases away from standard parallels. Shapeson large-scale maps of small areas essentially true Used for maps of North America. USGS Base Maps for 48 conterminous States with standard parallels 33 N, and 45 N (maximum scale error 2 ½ %). for TOPO maps, standard parallels vary. - Used for many topographic maps and for State Base Map series.
LAMBERT CONIC PROJECTION(Northern Hemisphere) North StandardParallel Polar Axis Central Meridian South StandardParallel Parallel ofGrid Origin(Base Parallel) http://ngs.ky.gov/pdf-ppt/BB/KySingleZone.ppt
Common Used Projections • Stereographic Projection - This is a Azimuthal projection - Directionstrue only from center point of projection. Scale increases away from center point. Any straight line through center point is a great circle. Distortion of areas and large shapes increases away from center point. - Used for maps of Antarctica and Arctic, for TOPO maps and navigating in latitudes above 80º, and for some geophysical maps and NEXRAD precipitation products.
3 Coordinate System • There are many different coordinate systems, based on a variety of geodetic datums, projections, and units in use • Geographic coordinate systems (no projection): Spheroid (or Ellipsoid)-based systems, local systems. • Projected coordinate systems: world, continental, polar, US National Grids, UTM, state plane. open ArcGIS for a demo
Geographic Latitude/Longitude on a flat surface (WGS 84 datum) Scale, distance, area, and shape are all distorted with the distortion increasing toward the poles.
Geographic Latitude/Longitude in GIS system 90º East West North equator 0 º 180 º -180 º Prime Meridian 0 º South -90 º open ArcGIS for a demo
Universal Transverse Mercator (UTM) Coordinate System • UTM system is transverse-secant cylindrical projection, dividing the surface of the Earth into 6 degree zones with a central meridian in the center of the zone. each one of zones is a different Transverse Mercator projection that is slightly rotated to use a different meridian. UTM zone numbers designate 6 degree longitudinal strips extending from 80 degrees South latitude to 84 degrees North latitude. UTM is a conformal projection, so small features appear with the correct shape and scale is the same in all directions. (all distances, directions, shapes, and areas are reasonably accurate ). Scale factor is 0.9996 at the central meridian and at most 1.0004 at the edges of the zones. • UTM coordinates are in meters, making it easy to make accurate calculations of short distances between points (error is less than 0.04%) • Used in USGS topographic map, and digital elevation models (DEMs) • Although the distortions of the UTM system are small, they are too great for some accurate surveying. zone boundaries are also a problem in many applications, because they follow arbitrary lines of longitude rather than boundaries between jurisdictions.
Transverse-secant Cylindrical (Mercator) Projection Most New Mexico in Zone 13 CM: central meridian AB: standard meridian DE: standard meridian -108 -102 -105
false easting ~0 mE ~1,000,000 mE false northing equator 0 mN or 10,000,000 mS
Universal Polar Stereographic (UPS) Coordinate System • The UPS is defined above 84 degrees north latitude and south of 80 degrees south latitude. • The eastings and northings are computed using a polar aspect stereographic projection. • Zones are computed using a different character set for south and north Polar regions.
State Plane Coordinate System • To support high-accuracy applications, all US states have adopted their own specialized coordinate systems: State Plane Coordinates. For example, Texas has five zones based on the Lambert Conformal Conic projection, while Hawaii has five zones based on Transverse Mercator projection. http://www.pipeline.com/~rking/spc.htm
Other common used projected coordinate systems • Albers: - Albers Equal-Area Conic + NDA 27 (NDA 83, or WGS 84). For example: USGS Hydrologic unit maps • Lambert: - Lambert Conformal Conic + NDA 27 (NDA 83, or WGS 84) • Equidistant: - Equidistant Conic: NDA 27 (NDA 83, or WGS 84)
E1 < G1 < S1 S1 E = Distance on ellipsoidG = Distance on gridS = Distance on surface SF = Grid Scale Factor = Geodetic latitude G1 G2 < E2 < S2 S2 E1 E2 SF>1 Ellipsoid SF=1 G2 Topographic Surface(Ground) SF<1 Axis of Rotation North Standard Parallel Projection Grid E3 < S3 < G3 SF=1 G3 South Standard Parallel S3 SF>1 E3 Equatorial Plane LAMBERT GROUND, GRID, and ELLIPSOID http://ngs.ky.gov/pdf-ppt/BB/KySingleZone.ppt
Conversion of Projection, Datum, Coordinate System • In one GIS project or database, all layers should have the same coordinate system • We need to do conversions • ArcToolbox has full functions to do this
4 Map Scale • Scale refers to the relationship or ratio between a distance on a map and the distance on the earth it represents. Maps should display accurate distances and locations, and should be in a convenient and usable size. • Map scales can be expressed as - representative fraction or ration: 1:100,000 or 1/100,000 - graphical scale: - verbal-style scale: 1 inch in map equal to 2000 feet on the ground or 1 inch = 2000 feet
GIS is Scaleless • In GIS, the scale can be easily enlarged and reduced to any size that is appropriate. • However, if we get farther and farther from the original scale of the layer, problems appear: - details no appear in an enlarged map - too dense in a reduced map
Scale in attention • The scale of the original map determines the largest map scale at which the data can be used. • Road map 1:50,000 scale can NOT be used accurately at the 1:24,000 scale. • Water coverage at 1:250,000 scale can NOT be used accurately at the 1:50,000 scale.
The earth on a computer screen • Computer screen ~ 1 million pixels • If entire earth displayed, each pixel would represent about 10 km x 10 km (100 km2) • Entire city of Socorro less than one pixel. • Spatial resolution is 10 km Anything less than 10 km across cannot be seen
Main References • Peter H. Dana, http://www.colorado.edu/geography/gcraft/notes/ • USGS, http://mac.usgs.gov/mac/isb/pubs/MapProjections/projections.html http://mac.usgs.gov/mac/isb/pubs/factsheets/fs01502.html • ESRI, http://www.esri.com • JMU,http://maic.jmu.edu/sic/standards/scale.htm • PipeLine, http://www.pipeline.com/~rking/spc.htm • Colorado State U. http://www.cnr.colostate.edu/class_info/nr502/lg1/map_projections/ • Kang-tsung Change, 2003, Introduction to Geographic Information Systems (2nd Edition), McGraw-Hill Higher Education press. • Paul A. Longley et al., 2001, Geographic Information Systems and Science, John Wiley & Sons press. • Keith C. Clarke, 2003, Getting Started with Geographic Information System (4th Edition), Prentice Hall press.