Download
1 / 44
440 likes | 633 Views
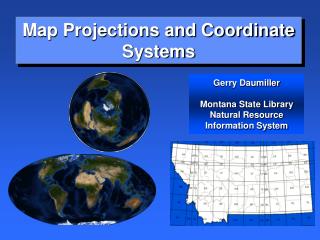
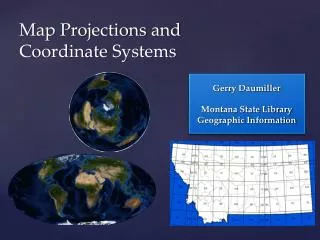
Gerry Daumiller Montana State Library Geographic Information. Map Projections and Coordinate Systems. When you look at a globe, you understand that things on the edge will look weird. On a flat map, weird is not good. Map Projections. Why are they important?.

E N D
Gerry Daumiller Montana State Library Geographic Information Map Projections andCoordinate Systems
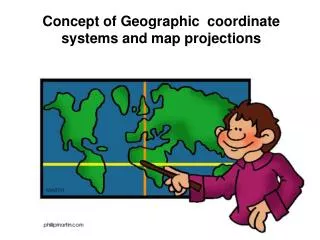
When you look at a globe, you understand that things on the edge will look weird. On a flat map, weird is not good.
Map Projections Why are they important? An important thing to remember about map projections is that you can not generally measure distances and areas accurately from projected data. The next slides show some examples of this.
Length Distortion on World Maps Robinson Projection -- 16,930 Miles Oblique Mercator Projection -- 10,473 Miles Length of the Arctic Coastline of Russia Mercator Projection -- 31,216 Miles
Area Distortion on World Maps Mollweide Projection (equal-area) Mercator Projection Lower 48 States -- 30,730,000 Sq Miles Lower 48 States -- 52,362,000 Sq Miles Columbia -- 4,471,000 Sq Miles Columbia -- 4,456,000 Sq Miles
Linear Distortion on National Maps Albers Equal Area Projection -- 2564.3 Miles Oblique Mercator Projection -- 2583.9 Miles Difference = 19.6 Miles One part in 132 0.76 Percent
Area Distortion on National Maps Lambert Conformal Projection -- 147,657 Square Miles Albers Equal Area Projection -- 148,993 Square Miles Difference = 1336 Square Miles One part in 111 0.90 Percent
Linear Distortion on Local Maps Montana State Plane Coordinates – 38,189.6 feet Oblique Mercator Projection – 38,212.1 feet Difference = 27.5 feet One part in 1742 0.0574 Percent
Area Distortion on Local Maps Montana State Plane Coordinates -- 122,314.3 Acres Albers Equal Area Projection -- 122,425.2 Acres Difference = 110.9 Acres One part in 1104 0.091 Percent
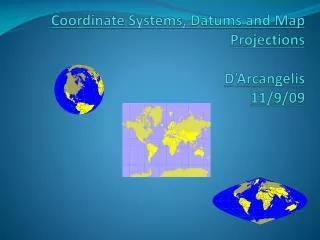
A map projection is a method or a type of equation used to transform three-dimensional coordinates on the earth to two-dimensional coordinates on the map. • A coordinate system usually includes the specification of a map projection, plus the three dimensional model of the Earth to be used, the distance units to be used on the map, and information about the relative positions of the two dimensional map and the model of the Earth. Coordinate Systems vs.Map Projections
Cylindrical Equal-Area Projection Mollweide Projection (equal-area,psuedo-cylindrical)
Conic Projections Lambert Conformal Albers Equal Area
There are an infinite number of coordinate systems possible, which can be created by choosing a projection and then tailoring its parameters to fit any region on the globe. Standardized coordinate systems have been developed to simplify the process of choosing a system. The two most common standard systems used in the United States are the State Plane Coordinate system and the Universal Transverse Mercator system. Standardized Coordinate Systems
Set of parameters that represent a model of the earth’s size and shape • Based on an ellipse with 2 radii • Semimajor axis (longer) and the semiminor (shorter) Spheroids
The Earth is not a perfect spheroid. • Different spheroids are used in different parts of the world to create the best possible model of the Earth’s curvature in each location. Spheroids
A Datum is a spheroid, plus the definition of the relationship between the Earth and the coordinates on the spheroid. Datums
There are four datums commonly used in Montana: NAD27, WGS84, NAD83, and NAD83 HARN. The latitude and longitude of a point on the ground is different in each datum. Datums
No Transformation Using Datums Correctly in ArcMap Distance = 0.353 m (1’ 1.9”)
Choosing a Projection: Checking Accuracy To find the true area of polygons, project them to an equal-area projection and recalculate their areas. To find the true distance between two points, use http://www.ngs.noaa.gov/cgi-bin/Inv_Fwd/inverse.prl or the Geodesic distance option in the ArcMap measure tool
Accuracy of Projections – State Plane Single Zone Greatest length error = 0.075% (1/1333)
Accuracy of Projections – State Plane Central Zone Greatest length error in gray counties = 0.008% (1/12500)
Accuracy of Projections – UTM Zone 12 Greatest length error on slide is 0.334% (1/299)
ArcMap 10.2 Google Maps The Web Mercator Projection Static Scalebar Dynamic Scalebar
Web Mercator – North end of Montana looks pulled apart to me. The Web Mercator Projection State Plane – Meridians correctly converge towards the North Pole
# Rotate Data Frame so that True North is straight up. import arcpy, os, math # Find the current map view and get its extent mxd = arcpy.mapping.MapDocument("current") df = mxd.activeDataFrame # Figure the latitude and longitude of the top center of the map mapRef = df.spatialReference geoRef = arcpy.SpatialReference(4269) ptTopY = df.extent.YMax ptTopX = (df.extent.XMin + df.extent.XMax)/2 ptTop = arcpy.PointGeometry(arcpy.Point(ptTopX, ptTopY), mapRef) # Project to geographic coordinates ptTop = ptTop.projectAs(geoRef) # Find the projected map coordinate 0.5 degrees of latitude south of the top center ptBtmX = ptTop.centroid.X ptBtmY = ptTop.centroid.Y - 0.5 ptBtm = arcpy.PointGeometry(arcpy.Point(ptBtmX, ptBtmY), geoRef) # Project back to map coordinates ptTop = ptTop.projectAs(mapRef) ptBtm = ptBtm.projectAs(mapRef) # Figure the angle between the top of the map and the point 0.5 degrees south of it dX = ptBtm.centroid.X - ptTop.centroid.X dY = ptBtm.centroid.Y - ptTop.centroid.Y rAngle = math.atan(dX / dY) * 180 / 3.1415926 print rAngle # Rotate the map to make north straight up and down df.rotation = rAngle # Refresh arcpy.RefreshActiveView() Python Script for True North