Download
1 / 46
460 likes | 579 Views
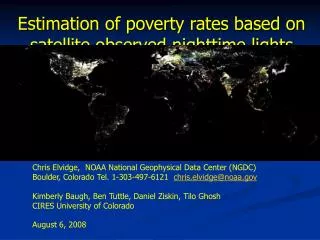
Change Detection In Satellite Observed Nightime Lights. Chris Elvidge , Earth Observation Group NOAA National Geophysical Data Center (NGDC). Boulder, Colorado chris.elvidge@noaa.gov September 28, 2011. The U.S. Air Force Defense Meteorological Satellite Program (DMSP)

E N D
Change Detection In Satellite Observed Nightime Lights Chris Elvidge, Earth Observation GroupNOAA National Geophysical Data Center (NGDC). Boulder, Coloradochris.elvidge@noaa.govSeptember 28, 2011
The U.S. Air Force Defense Meteorological Satellite Program (DMSP) Operational Linescan System (OLS) has a Unique capability to collect low-light imagery. Polar orbiting 3000 km swath 2.7 km ground sample distance (GSD) Two spectral bands: visible and thermal Nightly global coverage Flown since 1972 Will continue till ~2012 Visible Thermal
Fishing boats & city lights - Japan Originally designed for the detection of moonlit clouds, the OLS detects lights from cities, towns, villages, gas flares, fires, and heavily lit fishing boats. Gas flares – Persian Gulf Fires in Africa
Changes in Lighting • Growth in lighting associated with growth in development • Losses in lighting areas of conflict or economic collapse • Temporary lights (construction, holidays) • Changes in lighting sources (e.g. conversion from mercury vapor to sodium vapor lamps) • Changes in the efficiency of lighting fixtures
Outline • Brief history of DMSP nighttime lights • The version 2 time series: 1992-2003 • Review of changes in lighting 1992-2003 • Limitations of this data source • Review of application areas • Conclusion - future possibilities
Early DMSP Nighttime Lights Products – From Film The ability to detect nighttime lights with DMSP-OLS has been known since the early 1970's. Early OLS data were only available on film, which limited the product quality.
NGDC’s earliest nighttime lights product was made for the USA using lights detected in 29 orbits of nighttime DMSP data.
Adding more data – more lights were found. NGDC’s second nighttime lights product of the USA used 236 orbits of OLS data.
Nighttime Lights of the World The algorithms were then applied to ~1000 orbits of data covering the same time period to generate the first digitally derived global map of nighttime lights. Four different types of lights were distinguished: 1) human settlements, 2) gas flares, 3) fires, and 4) heavily lit fishing boats. The initial product was completed in 1997. The data were reprocessed in 1999 with an improved light detection algorithm. Original Reprocessed
Global Radiance Calibrated Nighttime Lights: 2000-01 and 2005-06? NGDC is producing a second global radiance calibrated nighttime lights product (2000-2001) for use in a NASA carbon cycle study. Data for a third (2005-06) are being collected. Dallas, Texas 2001
Eighteen Annual Cloud-Free Composites Available By FTPhttp://www.ngdc.noaa.gov/dmsp/global_composites_v2.html
A Large Number of Imaginative Ideas For Using the Lights Have Been Expressed Ancient Craters? “Thanks, Chris. Here's the USA at night image, with two rings highlighted. Looking for clues beyond the "settled" eastern half and the sparse western half of the USA, which is pretty apparent, I see rings and arcs which don't follow state boundaries, or rivers, or even the major topography. I didn't highlight the arc that is centered on North Carolina, for example, which goes from New York to the Great Lakes, through Indiana and all the way down to the Florida Panhandle, regardless of the Appalachians or the various river valleys.”
Review by Colleague “Chris, the circles are clearly the rims of the glasses of a giant cat that perished long ago and has since turned to dust. I was able to deduce this after careful examination of several other, all too obvious, nighttime light features similar to these, such as the great ‘Nighttime cat of Africa.‘”
Version 2 Annual Composites1992-2003 • Center half of swath • No moonlight • No sunlight • No glare • No “low-gain” data • No clouds • -65 to 65 latitude
Total Number of Coverages Satellite F10 - Year 1992
Total Number of Cloud-Free Coverages Satellite F10 - Year 1992
Average Visible Band Digital Number Satellite F10 - Year 1992
Stable Lights Average Visible Band Digital Number With Background Noise and Fires Removed Satellite F10 - Year 1992
Average Visible Band DN Color Composite (2003, 1998, 1992 as r,g,b)
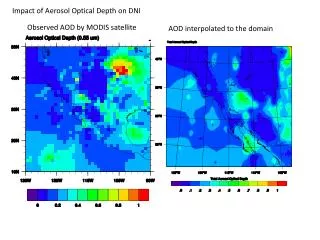
Overglow Digital number values across transect. LA – line drawn for transect.
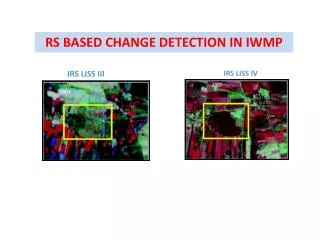
Interesting Features in Transects Hong Kong Transect across Hong Kong 1992 = blue 1998 = green 2003 = red The Hong Kong region 1992 = blue 1998 = green 2003 = red
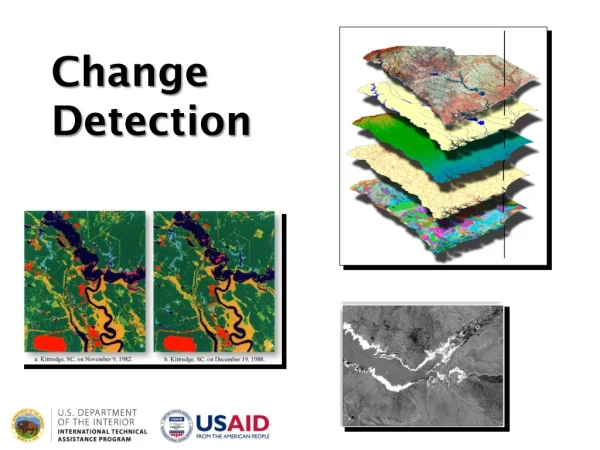
Can global trends in lighting change be observed? This is the 2003 lights minus 1992. Notice losses in the brightness of lights in the USA northeast, upper midwest, and west coast. Other places where the brightness of lighting declined include the UK, Belgium, former Soviet Union and Japan. Lighting grew in South Asia, China, Middle East, and Southern Europe.
Shortcomings of DMSP Lights • Coarse spatial resolution • 2.7 km GSD • 5+ km GIFOV • OLS lights are larger than sources on the ground • “Overglow” surrounds bright sources • No visible band calibration • 6 bit quantitization • Urban centers saturate • in operational data • No 3-5 um band for fires • No spectral information • on the type of lighting or • changes in lighting type. Contrast enhanced to show dim lighting
The Human Footprint Dataset Uses Nighttime Lights and Other Data Sources Available at http://www.ciesin.columbia.edu/wild_areas/
Global Rural Urban Mapping Project (GRUMP)Global Population Density Product Available at http://sedac.ciesin.org/gpw/global.jsp#
Global Map Of Poverty Number EstimatesBased on Nighttime Lights and DOE Landscan Population Density Available at http://www.ngdc.noaa.gov/dmsp/download_poverty.html
Gridded Estimates for Constructed Surface Area Density: 2000Based on Nighttime Lights and DOE Landscan Population Density Available at http://www.ngdc.noaa.gov/dmsp/download.html
Detection of Power OutagesFrom Hurricane Katrina • http://dmsp.ngdc.noaa.gov/interest/katrina.html
What do high resolution nighttime lights look like? 1.5 meter resolution nighttime lights from Cirrus DCS camera acquired from the NASA ER-2 over Las Vegas, Nevada on September 30, 2004.
FUTURE POSSIBILITIES • Concept for a moderate resolution satellite sensor for global mapping of nighttime lights (Nightsat) has been developed and will be published soon in IJRS. • Satellite mapping of electrical and radio frequency emissions is an untapped area for our community. • The biggest advances in improved high resolution urban data sources and open access are coming from the commercial sector. The scientific community should ride this wave!