Download
1 / 38
450 likes | 501 Views
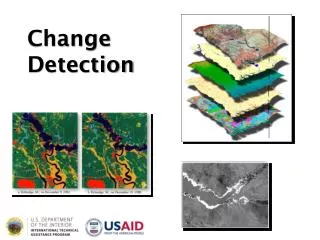
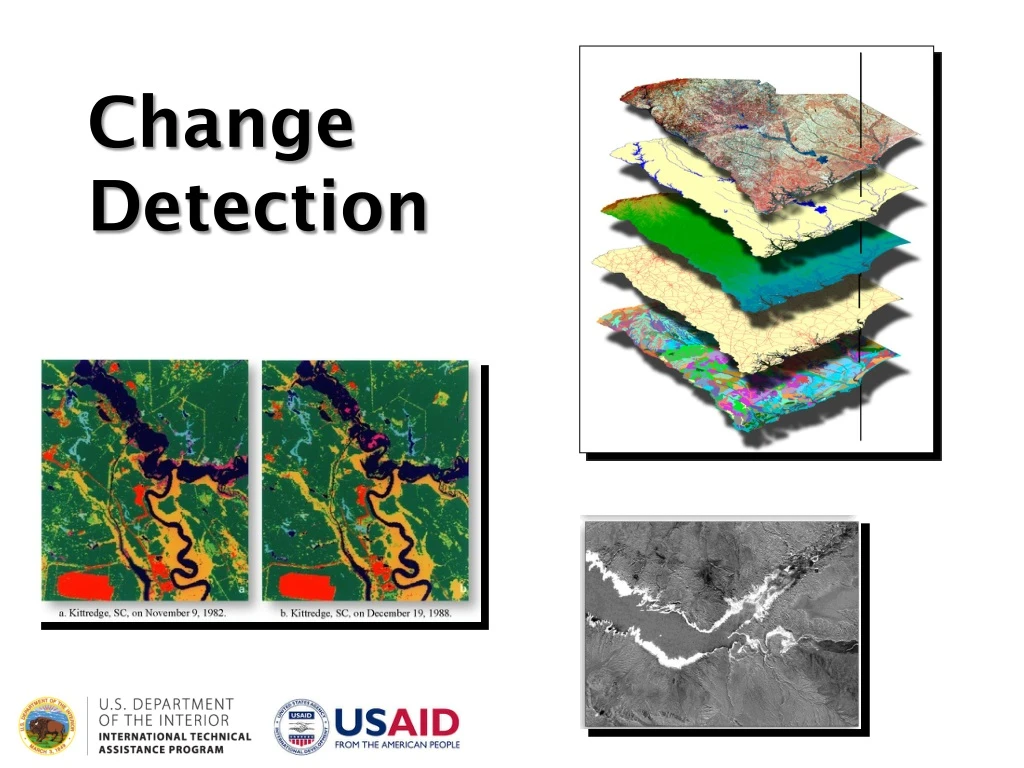
Change Detection. Digital Change Detection. Biophysical materials and human-made features are dynamic , changing rapidly. It is believed that land-use/land-cover change is a major component of global change with an impact perhaps greater than that of climate change.

E N D
Digital Change Detection • Biophysical materials and human-made features are dynamic, changing rapidly. • It is believed that land-use/land-cover change is a major component of global change with an impact perhaps greater than that of climate change. • Significant effort has gone into the development of change detection methods using remotely sensed data.
Region of Interest • The dimensions of the change detection region of interest (ROI) must be carefully identified and held constant throughout a change detection project. • It must be completely covered by n dates of imagery. • Failure to do so result in change detection maps with data voids that are problematic when computing change statistics.
Time Period • Be careful to identify the optimal change detection time period(s). • Traffic transportation studies might require a change detection period of just a few seconds or minutes. • Images obtained monthly or seasonally might be sufficient to monitor the greening of a continent.
Remote Sensing System Considerations • Successful remote sensing change detection requires careful attention to: • remote sensor system considerations, and • environmental characteristics. • Ideally, the remotely sensed data used to perform change detection is acquired by a remote sensor system that holds the following resolutions constant: temporal, spatial (and look angle), spectral, and radiometric.
System Parameter: Temporal Resolution • Temporal resolution should be held constant during change detection, if possible. • Use a sensor system that acquires data at approximately the same time of day. • Acquire remote sensor data on anniversary dates, e.g., Feb 1, 2005, and Feb 1, 2011. Anniversary date imagery minimizes the influence of seasonal Sun-angle and plant phenological differences that can negatively impact a change detection project.
System Parameter: Spatial Resolution • Ideally, the remotely sensed data are acquired by a sensor system that collects data with thesameinstantaneous-field-of-view on each date. • For example, Landsat TM data collected at 30 30 m spatial resolution on two dates are relatively easy to register to one another.
System Parameter: Spatial Resolution • Perform change detection using data collected from two different sensor systems with different IFOVs, for example, Landsat TM data (30 30 m) for Date 1 and SPOT HRV XS data (20 20 m) for Date 2. • Decide on a representative minimum mapping unit (e.g., 20 20 m) and then resample both datasets to this uniform pixel size.
Remotely sensed data used for change detection should be geometrically rectified
System Parameter: Spatial Resolution • Misregistration of the two images may result in the identification of false change between the datasets. • For example, just one pixel misregistration may cause a stable road on the two dates to show up as a new road in the change image.
System Parameter: Look Angle • Remote sensing systems like SPOT and QuickBird can collect data at off-nadir look angles as much as ±20° • Two images with significantly different look angles can cause problems when used for change detection. • For example, a SPOT image of a maple forest acquired at 0° off-nadir will look directly down on the top of the canopy. Conversely, a SPOT image acquired at 20° off-nadir will record reflectance from the side of the canopy. • Acquire data with approximately the same look angle
System Parameter: Spectral Resolution • Ideally, the same sensor system is used to acquire imagery on multiple dates. • For multiple sensor, select bands that approximate one another. • For example, Landsat MSS bands 4 (green), 5 (red), and 7 (near-infrared) and SPOT bands 1 (green), 2 (red), and 3 (near-infrared), can be used successfully with Landsat ETM+ bands 2 (green), 3 (red), and 4 (near-infrared).
System Parameter: Radiometric Resolution • Ideally, the sensor systems collect the data at the same radiometric precision on both dates. • When the radiometric resolution of data acquired by one system (e.g., Landsat MSS 1 with 6-bit data) is compared with data acquired by a higher radiometric resolution instrument (e.g., Landsat TM with 8-bit data), the lower-resolution data (e.g., 6-bits) should be decompressed to 8-bits for change detection purposes. • Brightness values associated with both dates of imagery are converted to apparent surface reflectance, which eliminates the problem.
Radiometric Correction of Multiple Dates of Imagery to Perform Change Detection • Absolute Radiometric Correction Use of an model atmosphere in conjunction with in situ atmospheric measurements (if possible) to correct for path radiance. • Relative Radiometric Correction - Single image normalization using histogram adjustment - Multiple date image normalization using regression techniques
Remote Sensing Environmental Considerations of Importance When Conducting Change Detection • Failure to understand the impact of various environmental characteristics on the remote sensing change detection process can lead to inaccurate results. • When performing change detection, it is desirable to hold as many environmental variables constant as possible.
Environmental Parameter: Soil Moisture • Ideally, soil moisture conditions should be identical for all dates of imagery used in a change detection project. • Extremely wet or dry conditions on one of the dates can cause change detection problems. • Stratify (cut out) those affected areas and perform a separate change detection analysis, which can be added back in the final stages of the project.
Environmental Parameter: Vegetation Phenology • Vegetation grows according to relatively predictable diurnal, seasonal, and annual phenological cycles. • Obtaining near-anniversary images greatly minimizes the effects of seasonal phenological differences that may cause spurious change to be detected in the imagery. • Agricultural crops - monoculture crops (e.g., corn, wheat) areplanted at approximately the same time of year on the two dates of imagery. A month lag in planting date between fields of the same crop can cause serious change detection error.
Multiple Date Composite Image Change Detection • Rectified multiple dates of imagery • This composite dataset can be analyzed to extract change information. • Unsupervised classification techniques will result in the creation of change and no-change clusters. • The analyst must then label the clusters accordingly.
Phenological Cycles: Crops in the Central Valley of California
Selection of the Change Detection Algorithm Change detection algorithms commonly used include: • multi-date composite image • image algebra (e.g., band differencing, band ratioing) • post-classification comparison • binary mask applied to Date 2 • ancillary data source used as Date 1 • spectral change vector analysis
Multiple Date Composite Image Change Detection • In this example, Principal Component 2 is a good indicator of change in the image
Image Algebra Change Detection • Identify change between two rectified images by band ratioing or image differencing. • Image differencing involves subtracting the imagery of one date from that of another. • If the two images have almost identical radiometric characteristics, the subtraction results in positive and negative values in areas of radiance change and zero values in areas of no change. • The results are stored in a new change image.
Post-classification Comparison Change Detection • Post-classification comparison change detection requires rectification and classification of each remotely sensed image. • The two maps are then compared on a pixel-by-pixel basis using a change detection matrix. • Every error in the individual date classification map will also be present in the final change detection map. • Individual classification maps used in the post-classification change detection method be as accurate as possible.
Can then create a decision change matrix illustrating all of the changes between dates across the landscape
Change Detection Using A Binary Change Mask Applied to Date 2
Spectral Change Vector Analysis • Consider the red and near-infrared spectral characteristics of a single pixel displayed in two-dimensional feature space. • The vector describing the direction and magnitude of change from Date 1 to Date 2 is a spectral change vector.
Change Detection example: Grand Canyon - San Francisco Peaks, Arizona
Landsat TM5 1992 Landsat TM5 2007 Classification 2007 Classification 1992