Download
1 / 46
1.08k likes | 2.07k Views
Change detection. Paul Aplin School of Geography, University of Nottingham, UK Chairman, Remote Sensing and Photogrammetry Society. Outline. Remote sensing background Multitemporal analysis Preprocessing requirements Change detection Image differencing Further reading

E N D
Change detection Paul Aplin School of Geography, University of Nottingham, UK Chairman, Remote Sensing and Photogrammetry Society
Outline • Remote sensing background • Multitemporal analysis • Preprocessing requirements • Change detection • Image differencing • Further reading • Introduction to practical exercise 4th ISPRS Student Consortium and WG VI/5 Summer School, Warsaw 13-19 July 2009.
Platforms, sensors and images • There are meaningful distinctions between remote sensing ‘platforms’, ‘sensors’ and ‘images’ • Platform • The craft on which a sensing device is mounted • Sensor • The sensing device or instrument itself • Image • The image data acquired by the sensing device 4th ISPRS Student Consortium and WG VI/5 Summer School, Warsaw 13-19 July 2009.
Commonest platforms Remote sensing platforms • There are three main categories of remote sensing platforms Spaceborne - Satellite - Shuttle Airborne - Aeroplane - Helicopter - Hot air balloon - Air ship - Tethered balloon Ground-based - Hand-held - Raised platform 4th ISPRS Student Consortium and WG VI/5 Summer School, Warsaw 13-19 July 2009.
Satellite path Field of view Ground track (imaged area) Satellite platforms Advantages Continuous data acquisition • Permanent orbit High geometric accuracy • Stable orbit (no atmosphere) Wide area of coverage • High vantage point Low data cost? Disadvantages Geometric distortion • Earth curvature High operation cost • Launch, etc. Low spatial detail? • High vantage point Cloud cover? High data cost? 4th ISPRS Student Consortium and WG VI/5 Summer School, Warsaw 13-19 July 2009.
Satellite orbit • Generally, remote sensing satellites are in low Earth orbits (LEOs), at altitudes of several hundreds of kilometres • These satellites orbit the Earth approximately every hour • Most remote sensing satellites follow a ‘polar’ orbital path (approximately north-south) • Polar orbits maximise the area of data acquisition, exploiting the Earth’s rotation 4th ISPRS Student Consortium and WG VI/5 Summer School, Warsaw 13-19 July 2009.
Polar orbit • As the Earth rotates eastwards, the satellite passes North-South (or South-North) acquiring a ‘swath’ of imagery 4th ISPRS Student Consortium and WG VI/5 Summer School, Warsaw 13-19 July 2009.
Polar orbit • As the Earth rotates eastwards, the satellite passes North-South (or South-North) acquiring a ‘swath’ of imagery • As the Earth continues to rotate, another image swath is acquired 4th ISPRS Student Consortium and WG VI/5 Summer School, Warsaw 13-19 July 2009.
Polar orbit • As the Earth rotates eastwards, the satellite passes North-South (or South-North) acquiring a ‘swath’ of imagery • As the Earth continues to rotate, another image swath is acquired • And again… 4th ISPRS Student Consortium and WG VI/5 Summer School, Warsaw 13-19 July 2009.
Geostationary orbit • Some remote sensing satellites follow a ‘geostationary’ orbital path • This means they constantly view the ‘same’ area of coverage • By orbiting in coincidence with the Earth’s rotation • All geostationary satellites orbit around the Earth’s equator • A common example is meteorological satellites • Other non-remote sensing satellites also use geostationary orbits • E.g., communications 4th ISPRS Student Consortium and WG VI/5 Summer School, Warsaw 13-19 July 2009.
Flight path Field of view Ground track (imaged area) Aeroplane platforms Advantages High spatial detail • Low vantage point On-demand acquisition • Requested flights Low operation cost? Avoid cloud cover? Low data cost? Disadvantages Narrow area of coverage? • Low vantage point Sporadic acquisition • Occasional flights Low geometric accuracy • Yaw, pitch, roll High data cost? 4th ISPRS Student Consortium and WG VI/5 Summer School, Warsaw 13-19 July 2009.
Described in lecture Sensors • There are various types of sensors or instruments • Any type of sensor can be operated from any remote sensing platform • Satellite, aircraft or ground-based Digital - Sensor - Camera - Video - Radar - LiDAR Analogue - Camera 4th ISPRS Student Consortium and WG VI/5 Summer School, Warsaw 13-19 July 2009.
Digital sensors • The most common types of remote sensing instruments are the digital sensors introduced previously • Hyperspectral sensors are also fairly common • Remote sensing at these parts of the electromagnetic spectrum (visible, infrared) is collectively known as ‘optical’ remote sensing Panchromatic sensors Create images comprising one broad spectral waveband Multispectral sensors Create images comprising several spectral wavebands 4th ISPRS Student Consortium and WG VI/5 Summer School, Warsaw 13-19 July 2009.
User Sun Sensor Incoming solar radiation Atmospheric distortion Received radiation Data supply Data download Reflected radiation Scattered radiation Ground receiving station Absorbed/transmitted radiation Earth’s surface Image acquisition 4th ISPRS Student Consortium and WG VI/5 Summer School, Warsaw 13-19 July 2009.
Radar sensors • Radar = ‘Radio Detection And Ranging’ • Radars are well known as navigational instruments, but also operate as remote sensing instruments • Using ‘microwave’ (long wavelength) part of electromagnetic spectrum • Radar remote sensing is very unlike optical remote sensing… • Radars are ‘active’, generating their own energy source • Optical sensors are ‘passive’, using the sun’s reflected energy • Each radar operates at a specific spectral wavelength • Optical sensors average reflectance across spectral wavebands • Common radar sensors • Synthetic Aperture Radar (SAR) – generally spaceborne • Side-Looking Airborne Radar (SLAR) – generally airborne 4th ISPRS Student Consortium and WG VI/5 Summer School, Warsaw 13-19 July 2009.
Radar Some return Emitted microwaves Little/ no return Scattered microwaves Radar image acquisition Radar instruments are ‘active’ and generate their own energy • Radars emit microwaves and record the ‘return’ from features Radar images distinguish features on the basis of ‘texture’ • Rough surfaces – high return (light image) • Smooth surfaces – low return (dark image) Radars have strong viewing capabilities • Penetrate cloud due to long wavelength • Operate at night due to own energy source Forest ‘rough’ surface Water ‘smooth’ surface 4th ISPRS Student Consortium and WG VI/5 Summer School, Warsaw 13-19 July 2009.
Remotely sensed images • Three main image characteristics are considered here • The term ‘resolution’ is only partly appropriate in some of these cases, but is used for convenience Spectral resolution Spatial resolution Temporal resolution 4th ISPRS Student Consortium and WG VI/5 Summer School, Warsaw 13-19 July 2009.
Typical spectral reflectance curves Band 5 – mid infrared Band 7 – mid infrared Band 1 - blue Band 2 - green Band 3 red Band 4 – near infrared Spectral resolution • Strictly speaking, spectral ‘resolution’ refers to the ‘width’ of a spectral waveband used to generate an image band • It is perhaps more useful to consider the ‘number’, ‘position’ and ‘width’ of all spectral wavebands comprising an image • Spectral image characteristics have been covered in earlier description of electromagnetic spectrum and optical/radar imagery Multispectral image 4th ISPRS Student Consortium and WG VI/5 Summer School, Warsaw 13-19 July 2009.
4 m 8 m 16 m 32 m 64 m 128 m 256 m 512 m Spatial resolution In simple terms, spatial resolution means ‘pixel size’ The concept is simple… Fine spatial resolution image = fine spatial detail small feature identification Coarse spatial resolution image = coarse spatial detail large feature identification As spatial resolution is degraded progressively, features become increasingly blurred and harder to identify Skukuza, Kruger National Park, South Africa 4th ISPRS Student Consortium and WG VI/5 Summer School, Warsaw 13-19 July 2009.
Area of coverage • Spatial resolution is related to the area of coverage of an image (the ‘swath width’ of the sensor) • Both spatial resolution and swath width may be affected by the altitude of the platform… • High altitude (e.g., satellite) • = wide swath • = coarse spatial resolution • Low altitude (e.g., aircraft) • = narrow swath • = fine spatial resolution • However… 4th ISPRS Student Consortium and WG VI/5 Summer School, Warsaw 13-19 July 2009.
Data processing and storage • …altitude is not the only factor that determines spatial resolution and swath width • E.g., certain satellite sensors have fine spatial resolutions and narrow swath widths • Another problem is the limited processing and storage capacity of the instruments • Each image pixel requires a certain amount of storage space, regardless of spatial resolution • For instance, two images… • with ‘different’ swath widths/spatial resolutions • but the ‘same’ number or pixels (rows, columns) • will require the ‘same’ amount of storage space • Therefore, there is a ‘play off’ between spatial resolution and swath width • Fine spatial resolution = narrow swath width • Wide swath width = coarse spatial resolution Swath width = 3 km Spatial resolution = 500 m No. pixels = 24 Storage space = e.g., 6 Mb Swath width = 6 km Spatial resolution = 1 km No. pixels = 24 Storage space = e.g., 6 Mb 4th ISPRS Student Consortium and WG VI/5 Summer School, Warsaw 13-19 July 2009.
Practical examples • In practical terms, swath widths and spatial resolutions can vary considerably • From images extending across 1,000s kilometres with pixels measuring 10s kilometres… • …through images extending across 100s kilometres with pixels measuring 10s metres… • …to images extending across 100s metres (or less) with pixels measuring 10s centimetres (or less) 4th ISPRS Student Consortium and WG VI/5 Summer School, Warsaw 13-19 July 2009.
Temporal resolution • Temporal resolution refers to the frequency of image acquisition at a constant location • Other, synonymous terms are ‘repeat cycle’ or ‘revisit time’ • This concept is most applicable to satellite sensors, since airborne remote sensing occurs on an irregular basis • A collection of images over time of a constant location are known as a ‘multitemporal’ image or data set • As with spatial resolution, the concept is simple… • Short temporal resolutions enable frequent observation of dynamic features • Long temporal resolutions enable occasional observation of long-term change • The chief determinant of temporal resolution is satellite orbit, but also significant are tilting capabilities, latitude and swath width • Certain sensors can ‘tilt’ away from their normal orbital ground track, observing targeted features relatively frequently • ‘Polar’ orbits lead to frequent coverage at high latitudes (e.g., polar regions) • Wide swath sensors cover large areas, returning relatively frequently to any location • Therefore, by extension, there is also a ‘play off’ between temporal resolution and spatial resolution! 4th ISPRS Student Consortium and WG VI/5 Summer School, Warsaw 13-19 July 2009.
2 Sep 2004 3 Sep 2004 6 Sep 2004 4 Sep 2004 1 Sep 2004 5 Sep 2004 Hurricane FrancesOrbView-2 image Monitoring example • In practical terms, temporal resolutions can vary considerably • From every half hour for meteorology sensors… • …to weeks or even months for narrow swath sensors • The key is to select suitable imagery related to the feature to be monitored 4th ISPRS Student Consortium and WG VI/5 Summer School, Warsaw 13-19 July 2009.
Multitemporal imagery • Multispectral image = image comprising multiple spectral wavebands of a common area • Multitemporal image data set = multiple images acquired at different times of a common area Multitemporal Landsat imagery September 1972 December 1978 March 1987 June 1990 4th ISPRS Student Consortium and WG VI/5 Summer School, Warsaw 13-19 July 2009.
Multitemporal analysis • Any form of analysis involving multitemporal imagery Multitemporal Landsat imagery Normalized difference vegetation index September 1972 December 1978 March 1987 June 1990 4th ISPRS Student Consortium and WG VI/5 Summer School, Warsaw 13-19 July 2009.
Preprocessing • To enable multitemporal analysis, images acquired at different times must share certain common properties • Often image preprocessing is necessary • Preprocessing refers to initial procedures conducted to prepare imagery for subsequent analysis • Main types of preprocessing: • Radiometric calibration • Cosmetic operations (correcting for missing lines, etc.) • Atmospheric correction • Illumination correction • Geometric correction (and/or registration) • Terrain correction • For multitemporal analysis • Geometric registration is essential to ensure that the images overlay each other precisely • Other corrections may be useful to ensure that any differences in the images are not a result of instrument deterioration, atmospheric interference, variations in illumination (time of day/year), and geometric and topographic distortion 4th ISPRS Student Consortium and WG VI/5 Summer School, Warsaw 13-19 July 2009.
Atmospheric correction • Atmospheric distortion affects remotely-sensed imagery, contributing (erroneously) to pixel values • Atmospheric correction is necessary where reflectance values are desired (as opposed to simple DNs) and where images are being compared over time • There are many methods for atmospheric correction, none of which is perfect and some of which are very complex • Relatively simple and common methods include: • Dark object subtraction • Histogram matching 4th ISPRS Student Consortium and WG VI/5 Summer School, Warsaw 13-19 July 2009.
Band 2 0 DNs 255 Frequency 40 (Min) 67.12 (Mean) 204 (Max) Range (DN) Dark object subtraction • The most common atmospheric effect on remotely-sensed imagery is an increase in DN values due to haze, etc. • This increase represents error and should be removed • Dark object subtraction simply involves subtracting the minimum DN value in the image from all pixel values • This approach assumes that the minimum value (i.e. the darkest object in the image) ‘should be’ zero • The darkest object is typically water or shadow 4th ISPRS Student Consortium and WG VI/5 Summer School, Warsaw 13-19 July 2009.
2001 Hist mtch 2001to1992 1992 Min 42 Mean 67 Max 254 Min 59 Mean 74 Max 254 Min 59 Mean 75 Max 254 SD 10 SD 8 SD 8 Band 1 Band 1 Band 1 Histogram matching • Histogram matching is a very simple and fairly crude method of atmospheric correction • This involves adjusting one image to approximate another by aligning their histograms • This approach assumes that the ‘general’ differences between the images are due to external (e.g., atmospheric) effects • Histogram matching nullifies these general differences, and remaining differences represent ‘real’ change between images 4th ISPRS Student Consortium and WG VI/5 Summer School, Warsaw 13-19 July 2009.
Unregistered image 1 1 N Scale 2 2 3 3 Geometric registration • Geometric registration involves registering an image without locational information to a known map coordinate system • This can be done by co-registering one image to another • This often involves: 1. Identifying ground control points 2. Resampling the image Registered image 4th ISPRS Student Consortium and WG VI/5 Summer School, Warsaw 13-19 July 2009.
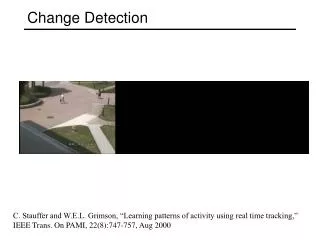
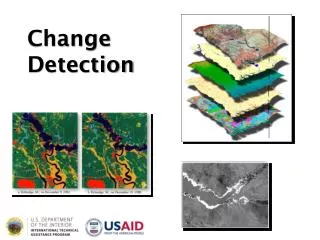
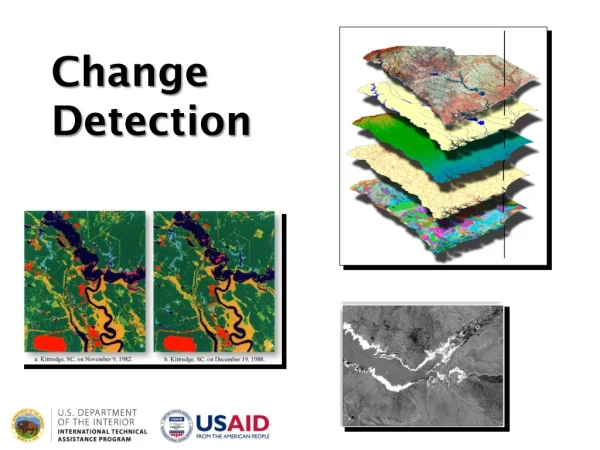
Change detection • One common type of multitemporal analysis is change detection • Change detection involves the direct comparison of two or more images to identify how areas change over time • Various methods of change detection are possible… 4th ISPRS Student Consortium and WG VI/5 Summer School, Warsaw 13-19 July 2009.
Change detection methods • Image ratioing • Division of one image by another • Operates on individual image bands • Areas of ‘change’ may be thresholded (e.g., > +25% and < -25%) • Post-classification comparison • Each image is classified independently, reducing preprocessing need • Resulting classifications are compared to identify change • Change detection results affected by accuracy of input classifications • Change vector analysis • Compares spectral properties of image pixels between dates • Expresses change as vectors in spectral space • Composite multitemporal image analysis • Images are combined to create a single multi-band image • E.g., two 4-band images would create an 8-band composite image • Various forms of analysis may be employed (classification, PCA) • Perhaps the most common and simple method, though, is… 4th ISPRS Student Consortium and WG VI/5 Summer School, Warsaw 13-19 July 2009.
Image differencing • Image differencing or image subtraction simply involves the subtraction of one image from another • No change = zero, change = +ve or –ve values • Operates on individual image bands • Areas of ‘change’ may be thresholded (e.g., > +25% and < -25%) 4th ISPRS Student Consortium and WG VI/5 Summer School, Warsaw 13-19 July 2009.
Reading for further information • Aplin, P., 2006, On scales and dynamics in observing the environment, International Journal of Remote Sensing, 27, 2123-2140. • Camps-Valls, G., et al., 2008, Kernel-based framework for multitemporal and multisource remote sensing data classification and change detection, IEEE Transactions on Geoscience and Remote Sensing, 46, 1822-1835. • Canty, M.J., 2007, Image Analysis, Classification and Change Detection in Remote Sensing, with algorithms for ENVI/IDL, CRC Press. • Chuvieco, E. (editor), 2008, Earth Observation of Global Change: The Role of Satellite Remote Sensing in Monitoring the Global Environment, Springer. • Coppin, P., et al., 2004, Digital change detection methods in ecosystem monitoring: a review, International Journal of Remote Sensing, 25, 1565-1596. 4th ISPRS Student Consortium and WG VI/5 Summer School, Warsaw 13-19 July 2009.
Practical exercise • Change detection using Idrisi image processing system 4th ISPRS Student Consortium and WG VI/5 Summer School, Warsaw 13-19 July 2009.
Data Dec 87 Mar 88 Jun 88 Sep 88 Dec 88 • Time series of NDVI imagery of Africa from the NOAA AVHRR sensor 4th ISPRS Student Consortium and WG VI/5 Summer School, Warsaw 13-19 July 2009.
Image differencing 4th ISPRS Student Consortium and WG VI/5 Summer School, Warsaw 13-19 July 2009.
Image thresholding 4th ISPRS Student Consortium and WG VI/5 Summer School, Warsaw 13-19 July 2009.
Image regression 4th ISPRS Student Consortium and WG VI/5 Summer School, Warsaw 13-19 July 2009.
Help – replacement files • Backup files are provided 4th ISPRS Student Consortium and WG VI/5 Summer School, Warsaw 13-19 July 2009.
Change detection End of lecture Paul Aplin School of Geography, University of Nottingham, UK Chairman, Remote Sensing and Photogrammetry Society
The betfair blimp • During the 2005 Ashes, the betfair Blimp showed aerial television coverage throughout the series • Old Trafford, Manchester • 11-15 August • Match drawn • But lest we forget… • England win series • 12 September 4th ISPRS Student Consortium and WG VI/5 Summer School, Warsaw 13-19 July 2009.
Historical remote sensing • The earliest known examples of remote sensing involved taking photographs from (un-manned) balloons tethered above the area of interest Boston 13 October 1860 Photographed by James Wallace Black 4th ISPRS Student Consortium and WG VI/5 Summer School, Warsaw 13-19 July 2009.
Europe 11 August 1999 University of Nottingham METEOSAT ground receiving station • For years, Meteosat images were downloaded by a ground receiving station in The University of Nottingham • The station is located at the top of the Tower building • The images were provided free to the meteorological/remote sensing community, and accounted for a large proportion of the university’s website traffic • After years of service, the station was deactivated in late 2003 due largely to lack of support and funding 4th ISPRS Student Consortium and WG VI/5 Summer School, Warsaw 13-19 July 2009.
River Arun, West Sussex 22 July 1997 Compact Airborne Spectrographic Imager (CASI) Aerial image distortion • Aircraft movement can lead to severely geometrically distorted imagery • In this case, aircraft ‘roll’ has caused sensor movement ‘across’ the image swath, resulting in irregular edges 4th ISPRS Student Consortium and WG VI/5 Summer School, Warsaw 13-19 July 2009.