Download
1 / 26
260 likes | 263 Views
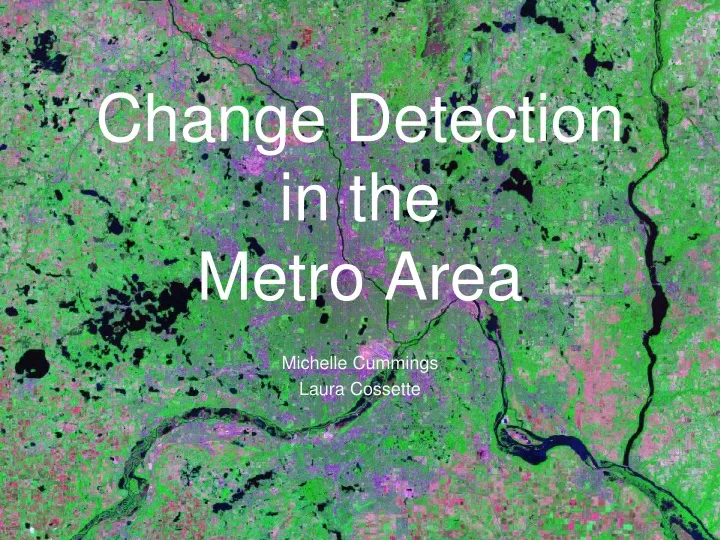
Change Detection in the Metro Area. Michelle Cummings Laura Cossette. Objectives. To provide statistical data on land cover change in the metro area over a 21 year period (1984-2005) To create visuals that aid in the understanding of this land cover change

E N D
Change Detection in the Metro Area Michelle Cummings Laura Cossette
Objectives • To provide statistical data on land cover change in the metro area over a 21 year period (1984-2005) • To create visuals that aid in the understanding of this land cover change • To provide some basic analysis of this data to strengthen understanding and application • To apply our knowledge from lecture and lab and improve our skills with ERDAS Imagine and data analysis
Relevance • Can be used by scientists, policy-makers, and educators • Science: • Data for future use • Policy: • City planning, population dynamics, land management, hydrological pathways and concerns, soil degradation • Education: • To convey general trends in land cover/use
Study Area • Twin Cities and surrounding metro area • Includes parts of Hennepin, Ramsey, Anoka, and Dakota counties • 652,000 acres or 1,020 square miles
Process • Data Collection • Image Preparation • Classification • Change Detection • Analysis • Accuracy Assessment • Reflections
Data Collection Data was provided by Professor Knight Landsat 5, TM sensor, path 27, row 29 Four years: 1984, 1991, 2000, 2005 Images taken in August or September Cropped images using AOI and Subset tools Used Inquire Box to find area of study Preparation
Classification • Delineate Training Areas • 5 classes • Urban • Agriculture • Grassland/ Bare soil • Forest • Water • 20-25 per class for each image • Merge Signatures • Run supervised Classification • Maximum Likelihood
1984 Urban Agriculture Forest Grassland/Soil Water
2005 Urban Agriculture Forest Grassland/Soil Water
2005 1984
2005 ?!?!
Reasons for Error • Choosing bad training areas • Not representative • Misclassification • Including bad pixels/edges • Bad class scheme • Urban and suburban are very different • Split up urban to urban and sub-urban • Ag fields were split into 2 classes • Use ‘cultivated’ instead of ‘Ag.’ and ‘Bare soil’ class • Haze and cloud cover • Algae on water? Yellow streak matches haze on original image
Change Detection • Post-Classification Change Detection • Matrix Union • Summary Report • Use change detection image for visual aid • Use summary report for statistical data
Change from 1984 to 1991 Urban • 71% stayed Urban • 8% to Agriculture • 7% to Forest • 11% to Grass/Soil • 2% to Water Agriculture • 29% stayed Agriculture • 27% to Urban • 18% to Forest • 20% to Grass/Soil • 5% to Water
Change from 1991 to 2000 Urban • 86% stayed Urban • 8% to Agriculture • 3% to Forest • 2% to Grass/Soil • 0.6% to Water Agriculture • 48% stayed Agriculture • 22% to Urban • 13% to Forest • 13% to Grass/Soil • 0.8% to Water
Change from 2000 to 2005 Urban • 88% stayed Urban • 1% to Agriculture • 5% to Forest • 4% to Grass/Soil • 1% to Water Agriculture • 29% stayed Agriculture • 29% to Urban • 27% to Forest • 15% to Grass/Soil • 0.7% to Water
Change from 1984 to 2005 Urban • 77% stayed Urban • 3% to Agriculture • 12% to Forest • 5% to Grass/Soil • 2% to Water Agriculture • 17% stayed Agriculture • 39% to Urban • 24% to Forest • 14% to Grass/Soil • 6% to Water
Analysis • Trends & Findings • Agricultural land is being converted to Urban development • From 1984 to 2005 (21 years) 39% of Ag. land (66mi2) was converted to Urban land • This may be off because some Ag. was considered Grassland/Soil. • Data is not accurate enough for good analysis of Grassland/Soil and Forest classes • Water did not change much (Duh!)
Accuracy Assessment • Reference data from Minnesota Geospatial Image Server (Web Map Service) • We used MnGeo’s WMS image server to get digital orthophotography. • 1991 data: USGS. Statewide. B&W. 1m res. Spring 1991. • 2000 data: Met Council. Twin cities. B&W. 0.6m res. Spring 2000 • 2005 data: 1. USGS. Color. 0.3m res. Spring 2006. 2. USDA. Color. 2m res. Summer 2006. • ERDAS Imagine • Got sample points • Stratified Random • 50 points per class/ 250 total • 3 of the 4 years • ArcMap • Imported sample points • Classified reference points using aerial imagery
Used ArcMap and ERDAS Imagine to assess sample points Accuracy assessment table (ERDAS) Accuracy assessment sampling points Zoom in on point
Accuracy Results 2005 1991: 65.6% 2000: 66.8% Total % Accuracy: 69.6%
Accuracy of Accuracy • Points that fall on or • close to borders/edges • Unidentifiable areas • due to poor image quality • or analyst ignorance • Multiple Analysts with • different interpretive skills • and judgment • Typing error (recording • wrong #, in wrong field on • table) • Ag field are identified as ‘Ag’ • instead of ‘Ag’ or ‘Bare Soil’ “Urban” or “Forest”???
Application • Main Use: • Learning tool for us! • To see general trends • Would be cautious to suggest use for specific projects because of poor class choices and low accuracy
Reflections • Classification scheme • Correcting for haze and cloud cover • Recode • ERDAS Imagine is frustrating and finicky at times • Lots of wasted time • Calculation of areas