Download
1 / 11
130 likes | 311 Views
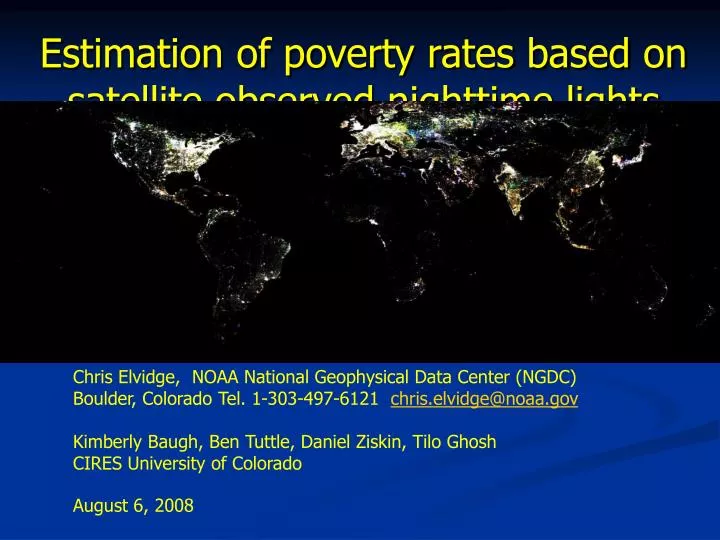
Estimation of poverty rates based on satellite observed nighttime lights. Chris Elvidge, NOAA National Geophysical Data Center (NGDC) Boulder, Colorado Tel. 1-303-497-6121 chris.elvidge@noaa.gov Kimberly Baugh, Ben Tuttle, Daniel Ziskin, Tilo Ghosh CIRES University of Colorado August 6, 2008.

E N D
Estimation of poverty rates based on satellite observed nighttime lights Chris Elvidge, NOAA National Geophysical Data Center (NGDC)Boulder, Colorado Tel. 1-303-497-6121 chris.elvidge@noaa.govKimberly Baugh, Ben Tuttle, Daniel Ziskin, Tilo GhoshCIRES University of ColoradoAugust 6, 2008
The U.S. Air Force Defense Meteorological Satellite Program (DMSP) Operational Linescan System (OLS) has a Unique capability to collect low-light imagery. Polar orbiting 3000 km swath 2.7 km ground sample distance (GSD) Two spectral bands: visible and thermal Nightly global coverage Flown since 1972 Will continue till ~2012 Visible Thermal
Fishing boats & city lights - Japan Originally designed for the detection of moonlit clouds, the OLS detects lights from cities, towns, villages, gas flares, fires, and heavily lit fishing boats. Gas flares – Persian Gulf Fires in Africa
Can lighting per person be used as an estimator for poverty levels? Landscan Population Count as red, lights as green and blue.
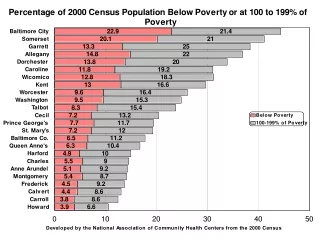
The World Bank’s World Poverty Map • Index based on $2 per person per day not a valid poverty indicator in developed countries. • Wide disparities in survey years and methods. • Governments can influence the outcome. • Infrequent updates. • Spatial variation of poverty levels within countries not revealed.
First Satellite Derived Global Poverty Map Population Count in Poverty Green 1-10, Yellow 11-50, Red > 50