Download
1 / 1

E N D
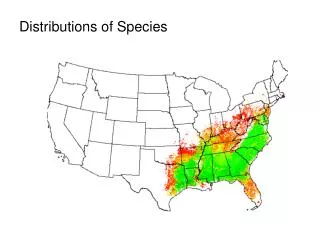
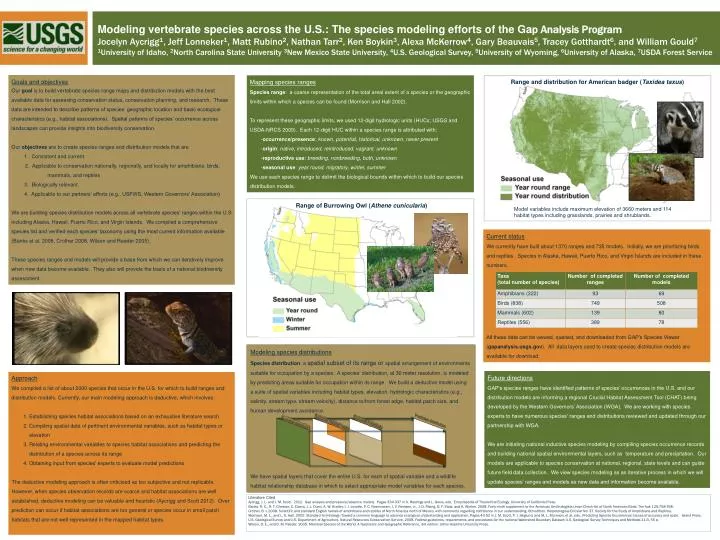
Modeling vertebrate species across the U.S.: The species modeling efforts of the Gap Analysis ProgramJocelyn Aycrigg1, Jeff Lonneker1, Matt Rubino2, Nathan Tarr2, Ken Boykin3, Alexa McKerrow4, Gary Beauvais5, Tracey Gotthardt6, and William Gould71University of Idaho, 2North Carolina State University 3New Mexico State University, 4U.S. Geological Survey, 5University of Wyoming, 6University of Alaska, 7USDA Forest Service Goals and objectives Our goal is to build vertebrate species range maps and distribution models with the best available data for assessing conservation status, conservation planning, and research. These data are intended to describe patterns of species’ geographic location and basic ecological characteristics (e.g., habitat associations). Spatial patterns of species’ occurrence across landscapes can provide insights into biodiversity conservation. Our objectives are to create species ranges and distribution models that are 1. Consistent and current 2. Applicable to conservation nationally, regionally, and locally for amphibians, birds, mammals, and reptiles 3. Biologically relevant 4. Applicable to our partners’ efforts (e.g., USFWS, Western Governors’ Association) We are building species distribution models across all vertebrate species’ ranges within the U.S including Alaska, Hawaii, Puerto Rico, and Virgin Islands. We compiled a comprehensive species list and verified each species’ taxonomy using the most current information available (Banks et al. 2008, Crother 2008, Wilson and Reeder 2005). These species ranges and models will provide a base from which we can iteratively improve when new data become available. They also will provide the basis of a national biodiversity assessment. • Mapping species ranges • Species range: a coarse representation of the total areal extent of a species or the geographic limits within which a species can be found (Morrison and Hall 2002). • To represent these geographic limits, we used 12-digit hydrologic units (HUCs; USGS and USDA-NRCS 2009). Each 12-digit HUC within a species range is attributed with: • -occurrence/presence: known, potential, historical, unknown, never present • -origin: native, introduced, reintroduced, vagrant, unknown • -reproductive use: breeding, nonbreeding, both, unknown • -seasonal use: year round, migratory, winter, summer • We use each species range to delimit the biological bounds within which to build our species distribution models. Range and distribution for American badger (Taxideataxus) 1 Model variables include maximum elevation of 3660 meters and 114 habitat types including grasslands, prairies and shrublands. Range of Burrowing Owl (Athenecunicularia) Current status We currently have built about 1370 ranges and 735 models. Initially, we are prioritizing birds and reptiles. Species in Alaska, Hawaii, Puerto Rico, and Virgin Islands are included in these numbers. All these data can be viewed, queried, and downloaded from GAP’s Species Viewer (gapanalysis.usgs.gov). All data layers used to create species distribution models are available for download. • Modeling species distributions • Species distribution: a spatial subset of its range or spatial arrangement of environments suitable for occupation by a species. A species’ distribution, at 30 meter resolution, is modeled by predicting areas suitable for occupation within its range. We build a deductive model using a suite of spatial variables including habitat types, elevation, hydrologic characteristics (e.g., salinity, stream type, stream velocity), distance to/from forest edge, habitat patch size, and human development avoidance. • We have spatial layers that cover the entire U.S. for each of spatial variable and a wildlife habitat relationship database in which to select appropriate model variables for each species. Future directions GAP’s species ranges have identified patterns of species’ occurrences in the U.S. and our distribution models are informing a regional Crucial Habitat Assessment Tool (CHAT) being developed by the Western Governors’ Association (WGA). We are working with species experts to have numerous species’ ranges and distributions reviewed and updated through our partnership with WGA. We are initiating national inductive species modeling by compiling species occurrence records and building national spatial environmental layers, such as temperature and precipitation. Our models are applicable to species conservation at national, regional, state levels and can guide future field data collection. We view species modeling as an iterative process in which we will update species’ ranges and models as new data and information become available. • Approach • We compiled a list of about 2000 species that occur in the U.S. for which to build ranges and distribution models. Currently, our main modeling approach is deductive, which involves: • 1. Establishing species habitat associations based on an exhaustive literature search • 2. Compiling spatial data of pertinent environmental variables, such as habitat types or • elevation • 3. Relating environmental variables to species habitat associations and predicting the • distribution of a species across its range • 4. Obtaining input from species’ experts to evaluate model predictions • The deductive modeling approach is often criticized as too subjective and not replicable. However, when species observation records are scarce and habitat associations are well established, deductive modeling can be valuable and heuristic (Aycrigg and Scott 2012). Over prediction can occur if habitat associations are too general or species occur in small patch habitats that are not well represented in the mapped habitat types. Predicted distribution Literature Cited Aycrigg, J. L. and J. M. Scott. 2012. Gap analysis and presence/absence models. Pages 334-337 in A. Hastings and L. Gross, eds. Encyclopedia of Theoretical Ecology. University of California Press. Banks, R. C., R. T. Chesser, C. Cicero, J. L. Dunn, A. W. Kratter, I. J. Lovette, P. C. Rasmussen, J. V. Remsen, Jr., J. D. Rising, D. F. Stotz, and K. Winker. 2008. Forty-ninth supplement to the American Ornithologists Union Check-list of North American Birds. The Auk 125:758-768. Crother, B. I. 2008. Scientific and standard English names of amphibians and reptiles of North America north of Mexico, with comments regarding confidence in our understanding. 6th edition. Herpetological Circular No. 37, Society for the Study of Amphibians and Reptiles. Morrison, M. L., and L. S. Hall. 2002. Standard terminology: Toward a common language to advance ecological understanding and application. Pages 43-52 in J. M. Scott, P. J. Heglund, and M. L. Morrison, et al. eds., Predicting Species Occurrences: Issues of accuracy and scale. Island Press. U.S. Geological Survey and U.S. Department of Agriculture, Natural Resources Conservation Service, 2009, Federal guidelines, requirements, and procedures for the national Watershed Boundary Dataset: U.S. Geological Survey Techniques and Methods 11:3, 55 p. Wilson, D. E., and D. M. Reeder. 2005. Mammal Species of the World. A Taxonomic and Geographic Reference, 3rd edition. Johns Hopkins University Press.