Download
1 / 39
390 likes | 578 Views
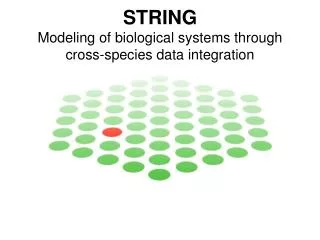
Modeling Species’ Distributions with Applications to Agriculture. Víctor Sánchez-Cordero Instituto de Biología, UNAM, México A. T. Peterson The University of Kansas, USA. Agroecosystems and Biodiversity. Systems of interacting species Crop organisms

E N D
Modeling Species’ Distributions with Applications to Agriculture Víctor Sánchez-Cordero Instituto de Biología, UNAM, México A. T. Peterson The University of Kansas, USA
Agroecosystems and Biodiversity • Systems of interacting species • Crop organisms • Pest organisms (rodents, insects, weeds) • Invasive species • Pollinators • Behavior of such systems can be simulated via detailed understanding of the ecological requirements of each component of the system
Case Studies • Corn ecology, areas of risk for natural areas from advancing agricultural frontier, and climate change effects • Risk assessment of potential for invasion by a new pest, a vector for Xylella fastidiosa • Risk assessment for crop damage by rodent pests in Veracruz, Mexico
Modeling Corn Ecology in Mexico • Points where maize is planted without irrigation are used to create an ecological niche model and geographic projection of potential distribution • Inventario Forestal Nacional is used to locate areas actually (2000) planted in maize and areas holding natural vegetation • Comparisons used to assess areas of potential expansion of the ‘frontera agricola’ • Climate change predictions used to assess how this scenario will change over next 50 yr
Actual Distribution (GREEN) Overlaid on Potential Distribution (BLUE)
Areas Suitable for Maize but Currently with Natural Vegetation (= Possible Expansion of Agricultural Frontier)
Protected Areas Most Vulnerable ANPs completely within the ecological niche of maize
Protected Areas Least Vulnerable ANPs outside of the ecological niche of maize, or mostly outside
Maize and Climate Change: Difference Maps DX scenario then AX scenario Red = worsening for maize Blue = improving for maize
Case Studies • Corn ecology, areas of risk for natural areas from advancing agricultural frontier, and climate change effects • Risk assessment of potential for invasion by a new pest, a vector for Xylella fastidiosa • Risk assessment for crop damage by rodent pests in Veracruz, Mexico
Case Studies • Corn ecology, areas of risk for natural areas from advancing agricultural frontier, and climate change effects • Risk assessment of potential for invasion by a new pest, a vector for Xylella fastidiosa • Risk assessment for crop damage by rodent pests in Veracruz, Mexico
PREDICTIVE DISTRIBUTION OF RODENT PEST SPECIES AGRICULTURAL CENSUS DATA ESTIMATED CROP LOSS IN EACH MUNICIPALITY: PLANTED MINUS HARVESTED AREA IS CROP LOSS RELATED TO THE PREDICTED DISTRIBUTION OF RODENT PEST SPECIES?
CROP Total area Area lost (ha) (ha) RICE 21,920 1,359 BEANS 57,988 9,426 SUGARCANE 213,221 69,670 CORN 514,213 49,189 OAT 1,198 239 COFFEE 175,027 9,427 GRASSES 1’322,985 5,315 SORGHUM 5,676 555 WHEAT 1,822 378
CROPSNATIVE RODENT PEST RICE 1 SQUIRREL BEANS13 RATS AND MICE SUGARCANE3POCKET GOPHERS CORN OAT COFFEE GRASSES SORGHUM WHEAT
Stepwise multiple regression analyses Dependent variable: crop damage in each crop in the 207 municipalities for Veracruz. Independent variable: proportional predicted coverage of that municipality by each of the 17 rodent species
CROP r2 RICE 0.65, P < 0.0001 BEANS 0.07, P < 0.05 SUGARCANE 0.04, P < 0.05 CORN 0.11, P < 0.05 OAT 0.35, P < 0.01 COFFEE 0.04, P < 0.05 GRASSES 0.12, P < 0.001 SORGHUM 0.07, P < 0.1 WHEAT 0.22, NS CONCLUSION: Areas of crop damage are not distributed at random with respect to distributional areas of pest rodents … risk of crop damage can be predicted based on the ecological potential of the species causing the damage ….
Summary • Agroecosystem behavior can be predicted based on the ecological requirements of component species • Risk of crop loss, crop inviability, and other phenomena can be predicted • Economic importance of biodiversity informatics … dead animals in museums can inform human economies!
MuitoObrigado victors@ibiologia.unam.mx