Download
1 / 14
140 likes | 229 Views
Extent, Effect & Evaluation of Maritime Activities from Satellite Remote Sensing Vittorio Barale Joint Research Centre of the European Commission Ispra, Italy. Lake Garda Northern Italy as seen by ASTER

E N D
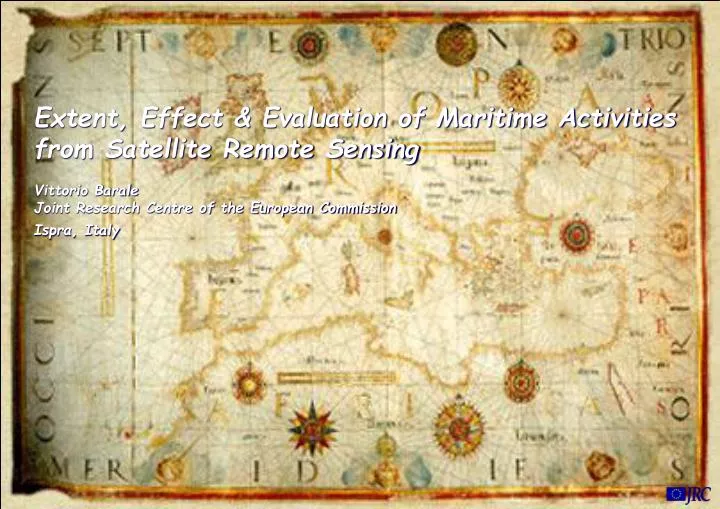
Extent, Effect & Evaluation of Maritime Activities from Satellite Remote Sensing Vittorio Barale Joint Research Centre of the European Commission Ispra, Italy
Lake Garda Northern Italy as seen by ASTER This ASTER image was acquired on 29 July 2000, and covers an area of 30 km by 57 km in north eastern Italy. Lake Garda was formed by glaciers during the last Ice Age, and is Italy's largest water body. It is 51 km long and about 3 to 18 km wide. The Sarca is the chief affluent of the lake, which is drained south-ward by the Mincio, into the Po and then into the Adriatic Sea. The version on the LEFT shows vegetation cover in red, water surfaces in blue, and built-up areas (villages, barren soil, roads) in light blue. Clouds appear white and their shadows are black. The version on the RIGHT has the land area masked out, while a harsh stretch was applied over the lake area to display variations in sediment load. Also visible are hundreds of boats and their wakes, criss-crossing the lake.
Integrated Coastal and Marine GIS Thematic Mapper data coastline evolution 1866-1967 land use in protected area
Integrated Coastal and Marine GIS < 1 1-2 2-3.5 3.5-5 5-7 7-9 9-12 12-18 18-30 30-80 >80 [g/m3] 15 February 1985 suspended sediment concentration from TM band 2 (0.56 μm) 22 May 1985
Pegasotowards a maritime sustainable management in the Mediterranean and the Black Sea SeaWiFS simulated true-color image, 22 October 2001 • PROCESSES • SPACE SCALES • TIME SCALES • …
Barale, V., J.M. Jaquet and M. Ndiaye (2008). ALGAL BLOOMING PATTERNS AND TRENDS IN THE MEDITERRANEAN SEA AS DERIVED FROM THE SEAWIFS DATA SET (1998-2003). Remote Sensing of Environment, special issue on: Earth Observations for Marine and Coastal Biodiversity and Ecosystems,Vol. 112, No. 8, p. 3300-3313. Med vegetationannual mean concentration of chlorophyll-like pigments,an indicator of algal biomass and primary production,from SeaWiFS data (1998-2003) JRC proc. SeaWiFS simulated true-color image, 22 October 2001
G. Ferraro, B. Bulgarelli, S. Meyer-Roux, O. Muellenhoff, D. Tarchi, and K. Topouzelis(2008). MULTI-SENSOR REMOTE SENSING OF COASTAL DISCHARGE PLUMES: AN EUROPEAN TEST SITE. In: Remote Sensing of the European Seas, V. Barale & M. Gade ed.s, SPRINGER, Heidelberg, p. 371-382. Med oil spillsnumber of observed (possible) oil spillsnormalized by the total number of observations,from SAR imagery (1999-2004) JRC proc. SeaWiFS simulated true-color image, 22 October 2001
27 May 2001 29 May 2001 19 May 2001 26 May 2001 Med riverswhere major rivers are present,coastal zones are permanently underthe direct influence of their plumes Po Rhone Ebro SeaWiFS simulated true-color image, 22 October 2001 Nile
Med runoffanthropogenic impact on speciesdiversity and biomass 16 May 2002 29 Apr 2002 04 May 2002 14 May 2002 • Alexandrium • taylori • – pocket beaches • Alexandrium • minutum • harbours or bays • Alexandrium • catenella • - bays, beaches SeaWiFS simulated true-color image, 22 October 2001 Western Mediterranean Sea, Catalan coast (April-May 2002), Chl from SeaWiFS data, JRC proc. 18 Jun 2001 11 Jun 2001 13 Jun 2001 20 Jun 2001 Eastern Mediterranean Sea, Egyptian-Israeli-Lebanese coast (June 2001), Chl from SeaWiFS data, JRC proc.
Med trendsalgal blooming anomalies (last decade),surface temperature change (~20 years) SeaWiFS simulated true-color image, 22 October 2001 (top) Barale, V., J.M. Jaquet and M. Ndiaye (2008). ALGAL BLOOMING PATTERNS AND TRENDS IN THE MEDITERRANEAN SEA AS DERIVED FROM THE SEAWIFS DATA SET (1998-2003). Remote Sensing of Environment, special issue on: Earth Observations for Marine and Coastal Biodiversity and Ecosystems,Vol. 112, No. 8, p. 3300-3313. (bottom) L. Nykjaer (2009). MEDITERRANEAN SEA SURFACE WARMING 1985-2006. Climate Research, Vol. 39, p. 11-17.
Black Sea Don Dnepr Bug Dnestr Azov Sea coccolithophorid summer bloom (Emiliana huxleyi) Danube Kerch Strait Kuban Rioni Bosphorus Marmara Sea Kizil Irmak Dardanelles Sakarya simulated true-colour as seen by SeaWiFS on 13 June 2000
January February March April May June August July September November October December Black Sea monthly pigments Chl monthly means from SeaWiFS data (1998-2005) NASA proc.
Black Sea interannual changes Chl yearly means from SeaWiFS data (1998-2005) Chl yearly anomalies from SeaWiFS data (1998-2005)
PEGASO : integrated (land, coastal interface, sea) ecosystem approach • ecosystem processes & space/time scales • (mutual) impact of different maritime sectors PEGASO : promote Med & Black Sea maritime sustainable management • overall strategic objective & broad vision of task at hand • based on a comprehensive, long term perspective PEGASO : JRC to contribute in exporting approach beyond EU borders • continuity between land and sea AND between regions • scientific understanding is THE key factor http://ies.jrc.ec.europa.eu/ http://emis.jrc.ec.europa.eu/ vittorio.barale@jrc.ec.europa.eu