Download
1 / 17
200 likes | 351 Views
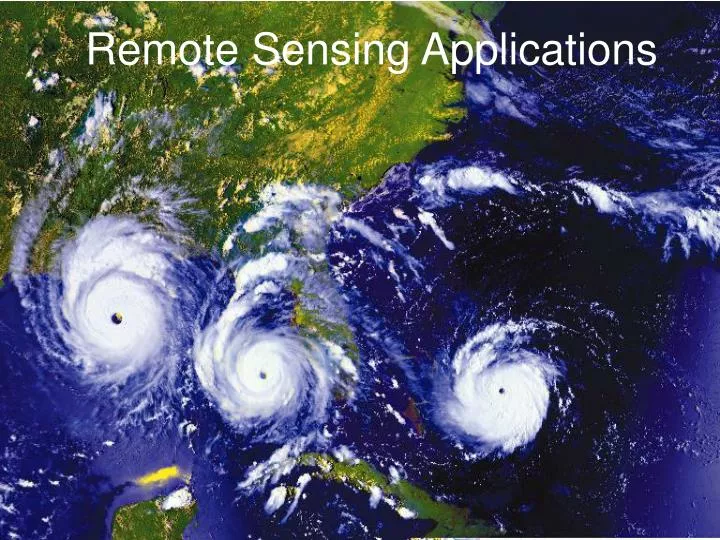
Remote Sensing Applications. Signatures – a unique identifier…. Computer Display of Remote Sensing Images. Individual bands of satellite data are “mapped” to the three “color guns” Color guns red , green , blue At most, 3 bands can be displayed at once

E N D
Computer Display of Remote Sensing Images • Individual bands of satellite data are “mapped” to the three “color guns” • Color guns red, green, blue • At most, 3 bands can be displayed at once • Displaying multispectral (mulitiple bands) data: • Different color gun (red, green, or blue) assigned to each band • Combination of red + green + blue for each pixel produces color image • Displaying panchromatic (single band) data: • Single band sent to the each of the red/green/blue color guns produces greyscale image
432 Composite Color Infrared 321 Composite True Color 3 for the price of 1…
Heat Island Effect: Atlanta, GA Issue: Atlanta regularly exceeds the temperature of the surrounding environment by as much as 10 degrees. This extreme difference causes thunderstorms to be generated and promotes ground level ozone. Measuring the effect the city has on its environment: Landsat TM Land use classification (bottom) Temperature map (top) computed from thermal band http://svs.gsfc.nasa.gov/stories/Landsat/atlanta_heat.html
Monitoring Urban Growth LandSat image Urban growth in the Washington D.C. metropolitan region 1973-1996 Red areas: New urban infrastructure built 1973-1985 Yellow: 1985-1990 Blue 1990-1996
Impervious Surface Mapping Baltimore/Washington area Shows extent of impervious surfaces. Red represents high concentrations of impervious surfaces. Blue represents moderate concentrations and green represents low concentrations of impervious surfaces. Base image: LandSat Impervious surface mapping: Derived from both LandSat & IKONOS satellite data http://visibleearth.nasa.gov/view_rec.php?id=1792
Mt. Saint Helens 1973 1983 1988 1992 Eruption: May 18, 1980 eruption Images before and after can be used to assess forest regrowth
Finding Fossils from Space LandSat Image Red: band 7 (shortwave infrared) Green: band 4 (near infrared) Blue: band 1 (blue) Vegetation & different rock types stand out clearly in this image target potential fossil sites http://visibleearth.nasa.gov/view_rec.php?id=188
Wildlife Habitats Canyon Creek Trout Spawning Beds Double Crossing Prairie Dog Colony The bright sandy patches are deposits from stream meanders that provide trout spawning beds. Both ant hills and prairie dog mounds display a similar and distinct appearance in the imagery Positive Systems, Inc. Shell Canyon Ant Hills
Precision Agriculture Water Deficit Index (WDI): Indicates rate of evaporative water loss from cropped fields Determined from measurements of field temperature and the spectral vegetation index measured by Landsat Thematic Mapper (TM) Tool for water conservation can be used to monitor the efficacy of irrigation and identify fields where evaporative water loss is greatest.
Noxious Weed Maps The figure at left is an example of a mapping project in the Northwestern United States. The purple pixels represent the values that are within the spectrum of spotted knapweed.
Assessing and Monitoring Grass and Forest Fires ASTER image (7/2001) 13 years after fires burned > 1.6 million acres in Yellowstone National Park, the scars are still evident. Burned areas appear gray, unburned forests dark green. http://asterweb.jpl.nasa.gov/gallery-detail.asp?name=yellowstonepark
1999 Landsat Image Yellowstone Park Boundary plainly visible in this 1999 Graphically represents differences in managerial policies among governmental agencies of the Greater Yellowstone Ecosystem
Monitoring Deforestation 1986 1975 Light blue: Deforested land & urban areas Red: Healthy vegetation 1992
Polar Ozone Hole TOMS: Total Ozone Mapping Spectrometer South Polar ozone hole image Centered on Antarctica