Download
1 / 18
190 likes | 415 Views
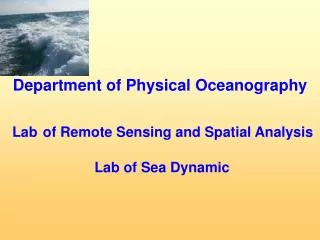
Department of Physical Oceanography Lab of Remote Sensing and Spatial Analysis Lab of Sea Dynamic. Lab of Remote Sensing and Spatial Analysis. Investigations based on: satellite data (AVHRR, SeaWiFS, Meteosat) own measured data by HRPT Data Receiver Sonda STD

E N D
Department of Physical OceanographyLabof Remote Sensing and SpatialAnalysis Lab of Sea Dynamic
Lab of Remote Sensing and SpatialAnalysis • Investigations based on: • satellite data (AVHRR, SeaWiFS, Meteosat) • own measured data by • HRPT Data ReceiverSonda STD • Tethered Spectral Radiometer Buoy • Fluorometer Tachymetr • Coulter counter Beam transmittance meter • exchange of data between: IO PAS, MI, MFI, RDANH • Models (M3D_UG, ICM, ECMWF, HIROMB) • Projects:
The sattelite monitoring HRPT Raw AVHRR data Data base of raw data ASDIK System of Automatic Registration, Geometric and Geographic Correction of AVHRR Data Data base of product PRODUCTS Quicklooks & UTM maps of: SST, Brightens temperature, Albedo, cloudiness WWW interface
Lab of Sea Dynamic Investigations focused on: hydrology, waves and ecohydrodynamic • Long-term changes hydrometeorological of climate • Long-term changes of the Baltic Sea level • Patterns of circulation in the Baltic • Ecohydrodynamic model of the Baltic Sea • Coastal upwellings in the Baltic Sea • Sea state modelling using system identification • methods • Modelling of nearshore currents induced by wind waves • Modelling of the interaction between currents and surface waves
Correlation betweenthe NAO index andrunoff from selected sub-catchment areasinto the Baltic Sea
Sea state modelling using system identification methods Comparison of System Identification modelling (right) and spectral wave model WAM results (left) for significant wave height (upper) and mean wave period (down) for 1100 hrs UTC on March, 7th, 2000. Methods are based on finding simple, mathematical transformations between two sets of variables (e.g. wind field and wave characteristics).
Modelling of nearshore currents induced by wind waves Significant influence on the coastal zone circulation has a wave breaking. Energy, which is dissipated in this process, causes coastal wave-driven currents. Analytical and numerical models of coastal zone circulation are based onradiation stress concept. Example of the longshore current model results (upper) along multi-bar bottom crossection(down). Incoming deep wave water parameters: Ho= 0.8m, To= 6s, θo= 65o
Operational System for Coastal Waters of Gdańsk Region Network of sea level river discharges chemical and biological stations Remote Sensing Monitoring Operational observations BOOS Meteorological forecasts UMPL Model ICM Hydrodynamic model M3D Observations and hydrological forecasts IMWM ProDeMO ecosystem model
Ecohydrodynamic modelProcesses included in the ProDeMo:1) nutrient uptake by phytoplankton, 2) phytoplankton grazing by zooplankton, 3) phytoplankton respiration, 4) phytoplankton decay, 5) sedimentation, 6) nutrients release from sediment, 7) atmospheric deposition, 8) denitrification, 9) mineralisation, 10) zooplankton respiration, 11) sedimentation of phosphorus adsorbed on particles,12) detritus sedimentation,13) zooplankton decay14) nitrogen fixation15) nutrient deposition. influenced the dissolved oxygen: 16) reaeration, 17) flux to atmosphere due to the over saturated conditions, 18) zooplankton respiration, 19) phytoplankton respiration, 20) assimilation, 21) mineralisation, 22) nitrification, 23 ) denitrification
Validation of the ProDeMo model
Spatial distribution of the nutrients – June 1999
The impact of the Vistula river on the coastal water of the Gulf of GdanskScenarios analysis by ecohydrodynamic model Due to reduction of phosphorus loads from 40.9 % for the policy target low to 45.5 % for Deep green scenario and nitrogen loads less than 10%, the phosphorus becomes a limiting nutrient in the Gulf of Gdansk in the analyzed scenarios. • The lowest biological productivity has been obtained for Deep green scenario - 7.5 % less than in the reference year 2002.
stability surface
stability stability spring autumn