Download
1 / 19
200 likes | 446 Views
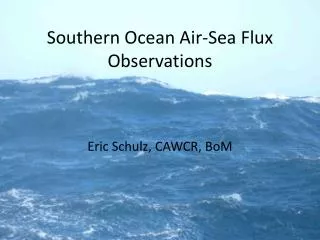
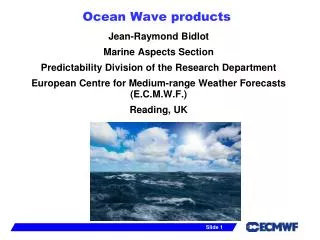
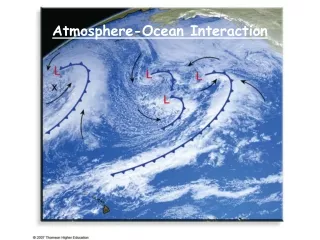
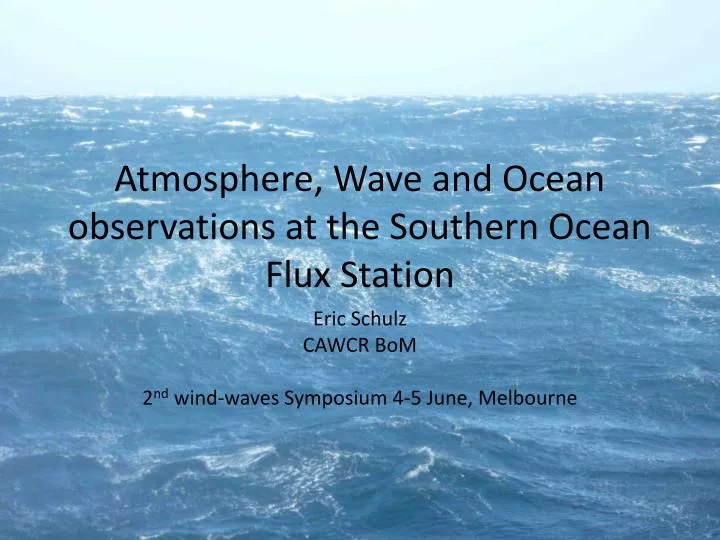
Atmosphere, Wave and Ocean observations at the Southern Ocean Flux Station. Eric Schulz CAWCR BoM 2 nd wind-waves Symposium 4 -5 June, Melbourne. Introducing the IMOS Southern Ocean Flux Station. IMOS facility Multiple moorings Freely available data Platform for other instruments

E N D
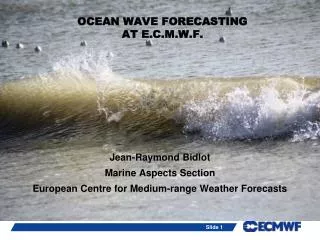
Atmosphere, Wave and Ocean observations at the Southern Ocean Flux Station Eric Schulz CAWCR BoM 2nd wind-waves Symposium 4-5 June, Melbourne
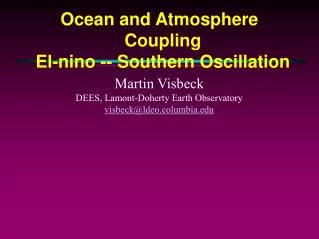
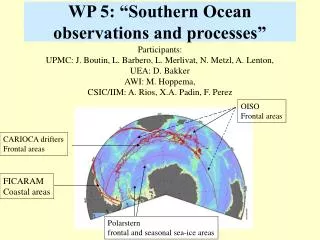
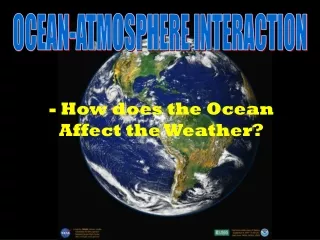
Introducing the IMOS Southern Ocean Flux Station • IMOS facility • Multiple moorings • Freely available data • Platform for other instruments • Annual visits • Located 47S, 142E in Sub-Antarctic zone, north of AAC SOFS, 47S, 142E in Sub-Antarctic zone
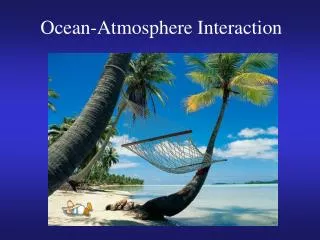
Southern Ocean Time Series(SOTS), including SOFS SAZ Sediment trap Southern Ocean Flux Station • Located 47oS, 140oE in the Sub-Antarctic Zone, southwest of Tasmania • Comprises: • SAZ Sediment Trap mooring • Pulse bio-geo-chemical mooring • Southern Ocean Flux Station mooring • Profiling drifters & Glider (ANFOG) Pulse Bio-geo-chemical mooring
SOTS & SOFS Data Holdings • Multidisciplinary • Multiplatform • Redundancy • Builds on 10-year SAZ record Example of data holdings related to SOTS Filled= data in hand, open=collection underway, dashed=planned collection
Vital Stats 2.7m Buoy weight: 1270 kg 1.6m 2.7m The Centre for Australian Weather and Climate ResearchA partnership between CSIRO and the Bureau of Meteorology
SOFS Tower and instruments Short- & Long-wave radiation Wind Temperature & Humidity Precipitation Air pressure The Centre for Australian Weather and Climate ResearchA partnership between CSIRO and the Bureau of Meteorology
Buoy well The Centre for Australian Weather and Climate ResearchA partnership between CSIRO and the Bureau of Meteorology
Loading the Anchor Anchor weight: 3900 kg The Centre for Australian Weather and Climate ResearchA partnership between CSIRO and the Bureau of Meteorology
Mooring Diagram Chain 8m Depth 4.5km Wire 1.9km Rope 4.1km The Centre for Australian Weather and Climate ResearchA partnership between CSIRO and the Bureau of Meteorology
Oceanographic instrumentation The Centre for Australian Weather and Climate ResearchA partnership between CSIRO and the Bureau of Meteorology
Measurements on SOFS • Atmospheric • Wind, temperature, humidity, pressure, radiation, rain (bulk fluxes of mass, heat, momentum) • Wave • Motion Reference Unit (CSIRO design) • Captures 3-D buoy motion and orientation at 5 Hz • Proxy for waves • Measures last 10 minutes of each hour • Ocean • Temperature (to 500m) • Salinity, pressure, PAR, sparse array • Currents (ADCP to 500m) • BGC at surface and 30-50m
SOFS data & Results • World first 12-month flux record in SO • First time SO in situ fluxes used to validate atmospheric models • Wave from SOFS and Pulse Net Heat flux and SST from SOFS-1 SOFS & NCEP (Josey) Sea Temperature SOFS1 & 2 Waves
SOFS data & Results Fluxes and SST from SOFS-1
24-months of wave & wind observations SWH & U10N SOFS 1 Mar 2010-Jan 2011 SOFS 2 Nov 2012-July 2013 SOFS 3 July 2013-Dec 2014 • SWH peaks at 22 m (September 2010) • More typical (believable) SWH max are 10-15 m • U10 average = 10 ms-1, max = 29 ms-1
24-months of wave & wind observations SWH & Tau SOFS 1 Mar 2010-Jan 2011 SOFS 2 Nov 2012-July 2013 SOFS 3 July 2013-Dec 2014 • Tau mean = 0.2 Nm-2 • Tau peak = 2.8 Nm-2
MRU-Triaxis comparison MRU and Triaxis wave package deployed on SOFS-2 • MRU is 0.15m larger than Triaxis • MRU is 3% larger than Triaxis • MRU overestimates the peaks
New Observations for wave-ocean mixing and currents • Program to understand wave induced mixing in upper ocean (Babanin, Hemer, Ghantous, Schulz, Rapizo) • New instruments on SOFS-4 (CSIRO & Swinburne) • Vert. profile ~cm of u & v down ~1m, ADCP (Nortek Aquadopp 1 Mhz profiler) in buoy hull • u & v point currents @30m (Nortek Aquadopp HR) • 3-D currents @30 m (Nortek Vector) • Frontier observations – what will we get?
Evidence for big breaking waves… 3m up Sonic Arms out of alignment SOFS-1 SOFS-3 Rain Gauge funnels missing Rain Gauge supports bent The Centre for Australian Weather and Climate ResearchA partnership between CSIRO and the Bureau of Meteorology