Download
1 / 36
370 likes | 555 Views
OCEAN-ATMOSPHERE INTERACTION: EL NINO AND THE SOUTHERN OSCILLATION. KELSEY HONIOUS AEROSPACE ENGINEERING. Meteorological Aspects of the El nino / Southern Oscillation (Eugene M. Rasmusson & John M. Wallace, 1983). Oceanographic Events

E N D
OCEAN-ATMOSPHERE INTERACTION:EL NINO AND THE SOUTHERN OSCILLATION KELSEY HONIOUS AEROSPACE ENGINEERING Meteorological Aspects of the El nino/ Southern Oscillation (Eugene M. Rasmusson & John M. Wallace, 1983) Oceanographic Events During El Nino (Mark A. Cane, 1983)
A Normal Southern Winter • The usually cold waters off the coast of Peru and Ecuador experience an increase in temperature near the beginning of the year (usually December or January). • The slacking of the Trade Winds causes the currents in the area to slow and the thermocline to deepen, resulting in a buildup of heat in the coastal waters.
Along Comes El Nino • For at least 18 months before an El Nio event, the Easterlies that drive the equatorial currents to the west are stronger than usual. • This causes unusually high sea levels in the west Pacific and abnormally low levels in the east. • Thermocline in the west deepens • SST (Sea Surface Temperature) is warmer than average in the west and colder in the east. • When the Easterly winds begin to die down, warming off the South American coast begins as usual.
Westerly wind anomalies begin in the western and central pacific. • These cause a slowing in the equatorial currents, and sea levels begin to fall in the west and rise in the east. • Rise of sea levels in eastern Pacific causes flooding in regions of South America. • Shift in winds causes storms to move from western Pacific towards east rain in eastern desert regions while wet regions of the tropical western Pacific experience severe droughts. Storms Storms
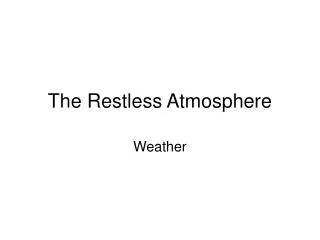
SST Variation During El Nio SST anomaly in degrees Celsius during the months of March through May of an El Nio year. SST anomalies in the following August -October SST anomalies in the following December - February
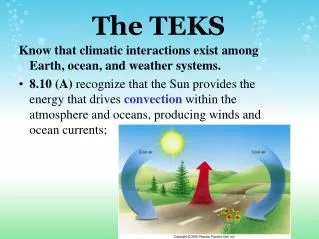
EL NINO SEA LEVEL VARIATION Truk, Micronesia Callao, Peru Top Panel: Sea level during El Nio events Bottom Panel: composite El Nio trend (solid line) and average for non-El Nio years (dotted line)
How The Water Gets There • Decrease in strength of Trade Winds excites clusters of Kelvin waves. • Equatorial waveguide allows waves to reach South American coast in a short time without losing much energy.
By autumn, SST’s at the South American coast are only slightly above normal. • Another warming begins in December and peaks early in the following year. • The SST then drops drastically, possibly becoming colder than normal. • The trade winds begin to pick back up, normal cycle resumes.
The Southern Oscillation • Atmospheric component of the El Nio event. • Fluctuation of pressures over regions on opposite sides of the Pacific. During an event, pressures over west Pacific are unusually high, while pressures over the coast of South America are anomalously low. Normal Pattern El Nio Pattern
Causes and precursors of El Nino are not fully known or understood, nor are the connections of the Southern Oscillation to global weather anomalies associated with the El Nino/Southern Oscillation (ENSO) phenomenon. • The two studies shown in this presentation examine the 1982-1983 ENSO event, which was anomalous in its lack of precursors and unusual timeline.
M. Cane: Oceanographic events during The 1981-1983 El Nio • Wind anomalies usually begin in Fall, but there were not observed Westerlies near the date line until Spring 1982. • However, most of the usual signs of El Nino were missing: • No unusually strong Easterlies • SST not abnormally cold in east or warm in west. • Sea levels did not rise in the west or sink in the east. • Thermocline not particularly deep in the west.
1982 : It Begins • SST high in early summer, but not above normal variation. • By August, SST in east Pacific was substantial, and westerly winds replaced easterlies over much of the equatorial Pacific. • As usual, sea level in the west Pacific reached peak in March/April, then began to recede. • Instead of rising to second peak in October, western sea level continued to decline drastically. • Sea levels in Mid-Pacific normal in June, then rose rapidly (25 cm in less than four months) • Rise in sea levels began at South American coast in Sep/Oct.
In December 1982, the thermocline at the coast of Peru was twice as deep as it had been a year previously. • In the months of July – October 1982, the SST in the east Pacific rose 2˚C, while the temperature at depth 100m rose 8˚C. • Warming was significant and wide enough the reverse the pressure gradient along the equator, causing the east-flowing Equatorial Undercurrent to disappear for the first time on record.
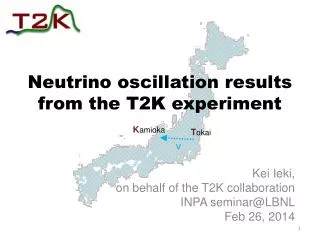
SST Anomalies Time-Longitude Section of SST Normal Cycle Cannonical El Nio 1982-1983 El Nio Off coast of Peru Singapore
Composite El Nino wind anomalies. Redlines indicate path of Kelvin Wave. Curve on right indicates sea level change at S. American coast SST anomaly maps. Top: Sep-Nov 1982 Bottom: March-May 1983
1983: The End? • Coastal temperatures continued to rise throughout the normal warming period and beyond. • By June 1983 (when this paper was written), temperatures were 6˚C or more above the normal values. • Temperatures began the recede in July 1983, wind patterns started to return to normal. • SST in much of eastern Pacific still remained much warmer than average.
Rasmusson/Wallace: Meteorological Aspects of ENSO, 1983 • Examines the atmospheric occurrences during an ENSO event. • Includes results from General Circulation Models (GCM’s), which are capable of realistic global climate simulations. • GCM’s have correctly simulated eastward shift of precipitation and upper level circulation patterns during El Nino, as well as teleconnections to extra tropical latitudes. • 1982-1983 event gave scientists the chance to check the independent accuracy of the GCM’s.
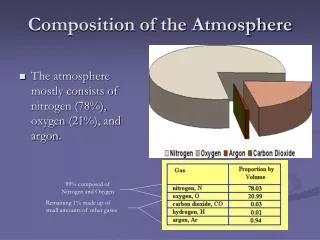
Strong SST gradient over equatorial Pacific: warm in west, cold in east. This gradient is associated with thermally direct circulation (Walker Circulation). • Sinking motion in the east • Westward flow along equator • Rising motion and deep convection in west • Eastward return flow at cirrus levels.
Normally, regions of the pacific east of date line receive almost no precipitation, while west gets constant precipitation. • During ENSO episode, ocean temperature rise in east and mid-Pacific causes the storms to shift eastward, producing severe droughts in Indonesia, and torrential rainfall in central Pacific. Note the correlation between A, B, and C Negative correlation between C and D
It’s Not Just The Tropics… • Earth’s rotation allows changes in tropical circulation to excite a wave pattern in upper troposphere than can cause anomalies in extra tropical circulation.
The 1982-1983 Event • Surface wind and sea level pressure shifts were not observed in 1981 or early 1982 as per the normal cycle. • SST near Peru did not begin sharp rise until Sep/Oct 1982. • Sea level pressure in Central Pacific did not begin drop until April 1982. • Surface winds shifted to westerly in June 1982. • Period of extreme precipitation began in central Pacific. • Western Pacific and southern Africa began experiencing record droughts.
SST anomalies from 1982-1983 episode Sea level pressure anomalies over Tahiti (central Pacific), and Darwin (Australia)
Movement of precipitous regions during 1982-83 epsisode as measured by satellite-sensed outgoing long-wave radiation
Peak of the episode • Anomalous patterns intensified from Dec 1982 to Feb 1983. • Droughts extended to Hawaii. • SST anomalies nearly twice normal ENSO values. (Temperatures above 29° C in shaded areas) • Southern Oscillation Index dropped to unprecedented -6
Effects on extra tropical latitudes • Circulation anomalies at jet stream levels (Dec-Feb) • In north Pacific, mean sea level pressures reached record lows. • The anticycloniccirculation over Canada was associated with unusually mild winter on Canada/U.S. border
Westerly wind anomalies across subtropical Pacific and southern borders of U.S. indicated intensification and southward movement of normal westerly jet stream. • Abnormally high number of winter storms on California coast • Flooding in parts of California and Gulf states. • Southwest mountain ranges buried under snow in spring.
The End….Finally. • Anomalous rainfall, low pressures in north North Pacific, and storm track across U.S. persisted through May 1983. • Southern Oscillation swung back to normal from February to May 1983 • SST in east Pacific began to fall, but second increase produced peak anomalies above 8˚C in May and June. Decreased drastically in early July, then gradually through September, but still remained above normal.
Proposed theory: • ENSO episodes may be superposition of two interrelated events, which usually occur in combination about 6 months apart. • Enhancement of mean annual cycle. Positive SST anomalies develop in Jan/Feb and spread west, peaking in May/June, disappearing by Sep/Oct. Response to swing in Southern Oscillation associated with weakening of Trade Winds • Broad scale warming of equatorial Pacific starting mid-year and disappearing a few months later. Response to pressure changes caused by swing in Southern Oscillation.
Theory Continued… • Typical ENSO episode may be an event of type 1 followed, with some overlap, by an event of type 2. • The 1982-1983 episode could have been a reverse of the normal sequence, beginning with the broad scale warming in late 1982 and then moving towards localized warming on the South American coast.
Summary • 1982-1983 El Nino began later than normal, had much larger amplitude of anomalies, and lingered longer than usual. • El Nino may be linked to global scale changes in weather patterns for duration of event. • Examination of the ‘82-’83 episode has lead to the proposed theory that El Nino actually consists of two interrelated events, which can possibly come in arbitrary order.
The Conclusions: • It cannot currently be proven that El Nino causes consistent extra tropical anomalies. • It is not known which of those anomalies in 1982-83 were a direct result of the El Nino and which were simply coincidences.
Future Research • Examination of causes behind the violent swings in the Southern Oscillation seen in certain events like the 1983 El Nino. • Can ENSO episodes be conclusively related to climate anomalies in other regions of the globe? • Is it possible to analyze the singular traits of any given El Nino in order to predict the severity of its effects, and the global reach of its deviations? • Will we ever be able to effectively predict an El Nino?