Download
1 / 47
510 likes | 825 Views
Ocean-atmosphere interactions. ENSO (El Nino-Southern Oscillartion) and PDO (Pacific Decadal Oscillation). NASA: 70% of global climate change due to Pacific Ocean Oscillations.

E N D
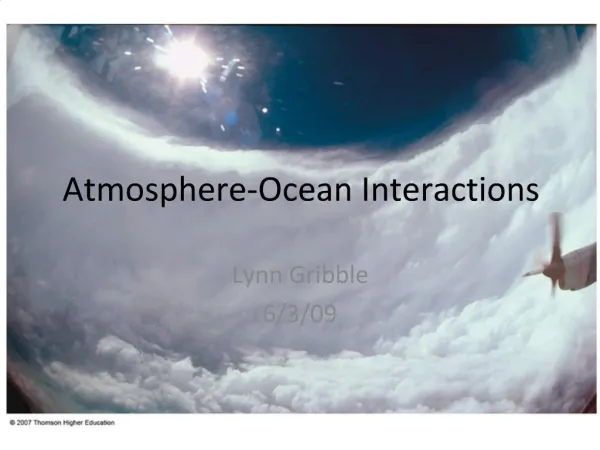
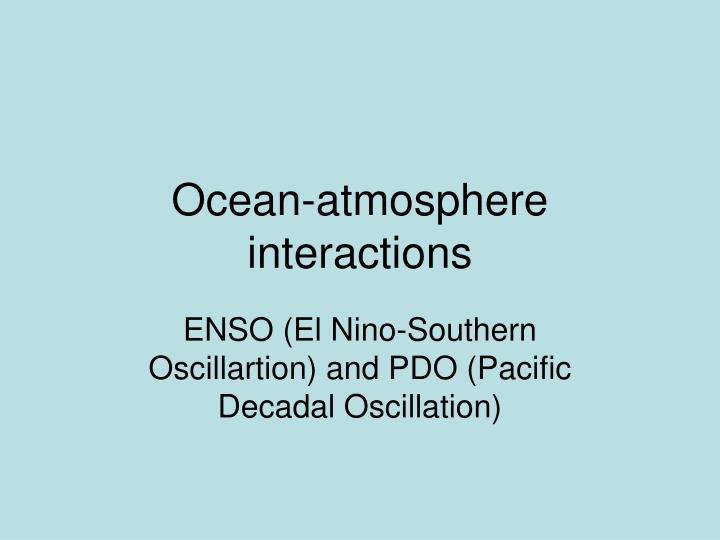
Ocean-atmosphere interactions ENSO (El Nino-Southern Oscillartion) and PDO (Pacific Decadal Oscillation)
NASA: 70% of global climate change due to Pacific Ocean Oscillations • “It can be shown with a simple climate model that small cloud fluctuations assumed to occur with two modes of natural climate variability- ENSO and Pacific Decadal Oscillations- can explain 70% of the warming trend since 1990, as well as nature of that trend, warming until the 1940’s, no warming until the 1970’s, and resumed warming since then.” Dr. (Meteorology) Roy W. Spencer, NASA lead investigator of U.S. Science Team Leader for NASA Earth Observervatory, July, 22, 2008 in Congressional testimony
PDO • The "Pacific Decadal Oscillation" (PDO) is a long-lived El Niño-like pattern of Pacific climate variability. While the two climate oscillations have similar spatial climate fingerprints, they have very different behavior in time. Fisheries scientist Steven Hare coined the term "Pacific Decadal Oscillation" (PDO) in 1996 while researching connections between Alaska salmon production cycles and Pacific climate (his dissertation topic with advisor Robert Francis). Two main characteristics distinguish PDO from El Niño/Southern Oscillation (ENSO): first, 20th century PDO "events" persisted for 20-to-30 years, while typical ENSO events persisted for 6 to 18 months; second, the climatic fingerprints of the PDO are most visible in the North Pacific/North American sector, while secondary signatures exist in the tropics - the opposite is true for ENSO. Several independent studies find evidence for just two full PDO cycles in the past century: "cool" PDO regimes prevailed from 1890-1924 and again from 1947-1976, while "warm" PDO regimes dominated from 1925-1946 and from 1977 through (at least) the mid-1990's. Shoshiro Minobe has shown that 20th century PDO fluctuations were most energetic in two general periodicities, one from 15-to-25 years, and the other from 50-to-70 years.
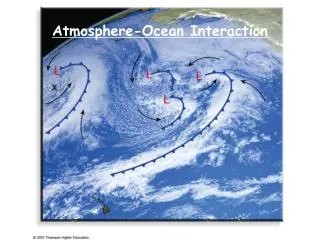
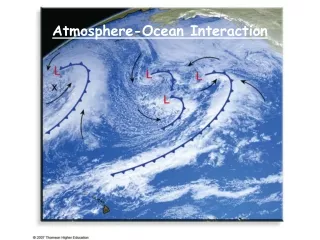
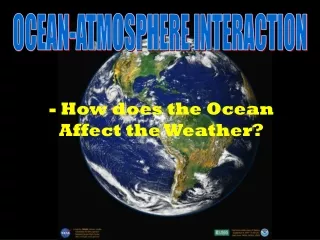
Normal conditions • High pressure and dry conditions over eastern Pacific • Low pressure and moist conditions over western Pacific, Australia, Indonesia, etc. • Trade winds flow east to westward • Thermocline is nearly 200 m deep in western Pacific and near surface in eastern Pacific, causing upwelling of Humbolt Current • Fishing industry is good
Fishing industry is fine; mackerel, anchovies, shrimp, sardines, etc.
El Nino characteristics • E. Pacific ocean warmed by 4 to 10 deg C- causes low pressure • Thermocline drops in east Pacific • East Pacific sea level 60 cm to 1 m higher • Air pressure drops in E. Pacific, rises in W. Pacific, Indonesia, Australia, Tahiti • Pressure gradient weakens, trade winds weaken or reverse direction • Polar front jet stream shifts equatorward • Heavy rains, floods to W. coasts of Americas • Drought to western Pacific • Increased number of icebergs south of 48 degrees N. and S. latitude • Global reduction of clouds = drier and warmer
El Nino Impacts • Rains, floods, and terrible fishing in E. Pacific • Agriculture, fisheries, food supply of developing countries impacted • Wetter conditions in southwestern and northwestern US, southern India, • Drier conditions W. Pacific, N. South America, SE Africa, N. India,
More El Nino imacts • 93% of Monsoon droughts occur during El Nino events • Number and duration of hurricanes decreases • Increases CO2 production by 1.4 ppm/ yr • Clearer skies worldwide- global warming? • Since 1972, El Nino has dominated over La Nina • 1998 El Nino caused 16% of world’s coral reefs to die. Since all regions have suffered “severe bleaching.”
La Nina impacts • Exaggerates normal conditions, • SST’s are lower than usual in E. Pac • Trade winds exceptionally strong
Major El Nino Events • 1790-93, 1828, 1876-78, 1891, 1925-26, 1982-83, 1997-98 • Other Recent El Nino Events: • 1986-87, 1991-92, 1993, 1994, 1997-98, 2002-03, 2004-05, 2006-07 • El Ninos identified in early Holocene records
Southern Oscillation Index Calculated from air pressure difference between Darwin, Australia and Tahiti. SOI = 10 x Pdiff - Pdiffav SD(Pdiff) Pdiff = average monthly Tahiti pressure - average monthly Darwin pressure Pdiffav = long term average of pressure difference SD (Pdiff) = long term average standard deviation of Pdiff for the month in question Sustained negative SOI values often indicate El Nino
ENSO Index using 6 variables: sea-level pressure, zonal, meridional, components of sfc winds, sst, and cloudiness fraction
What are precursors to failure of Walker Circulation? • More extensive sea-ice in the Antarctic and snow cover in central Asia • Two months before onset of El Nino high altitude winds (easterly subtropical jet stream) weaken • Changes in behavior of southern Hemisphere mobile polar highs • Weakening of southern Hemisphere westerlies between 35 and 55 degrees • Particulates from volcanic eruptions (El Chichon in March 1982, and Mount Pinatubo in June, 1991)
NASA: 70% of global climate change due to Pacific Ocean Oscillations • “It can be shown with a simple climate model that small cloud fluctuations assumed to occur with two modes of natural climate variability- ENSO and Pacific Decadal Oscillations- can explain 70% of the warming trend since 1990, as well as nature of that trend, warming until the 1940’s, no warming until the 1970’s, and resumed warming since then.” Dr. (Meteorology) Roy W. Spencer, NASA lead investigator of U.S. Science Team Leader for NASA Earth Observervatory, July, 22, 2008 in Congressional testimony