Download
1 / 31
310 likes | 476 Views
Ocean and Atmosphere Coupling El-nino -- Southern Oscillation. Martin Visbeck DEES, Lamont-Doherty Earth Observatory visbeck@ldeo.columbia.edu. General Atmosphere Ocean Circulation The surface energy balance. Top of atmosphere. seafloor.

E N D
Ocean and Atmosphere CouplingEl-nino -- Southern Oscillation Martin Visbeck DEES, Lamont-Doherty Earth Observatory visbeck@ldeo.columbia.edu
General Atmosphere Ocean CirculationThe surface energy balance Top of atmosphere seafloor Imbalance of energy flux at the top can be balanced by: Atmospheric Heat Transport Oceanic Heat Transport Air-sea interface
Radiative Energy Balance The imbalance of the top of the atmosphere radiation implies that there must be an internal heat transport by the combined action of ocean and atmosphere of ~6 1015 W 30°N/S. Ocean Atmosphere Top ofatmosphere
The Oceans Role in Climate • The annual heat flux between ocean and atmosphere is formed by the sum of all of the heat transfer process: • Solar radiation +168 • Terrestial radiation -66 • Evaporation -78 • Heat conduction -24
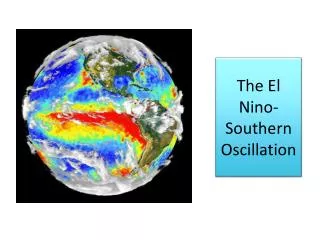
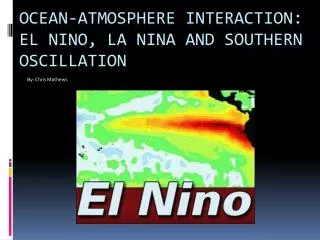
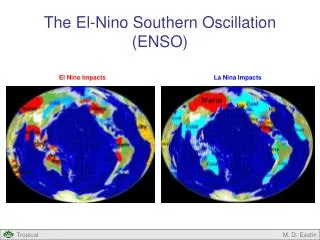
Climate Variability • Changes in equatorial Pacific ocean and atmosphere circulation associated with El Niño and La Niña events.
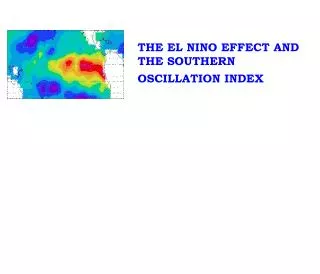
Sea Surface Temperature Anomalies • SST anomalies The ocean integrates fast atmospheric perturbations to create much longer lasting surface temperature anomalies. • El Niño/La Niña Along the equator the ocean is actively involved in creating an interannual oscillation that affects the atmosphere world wide and is predictable. Source: IRI
Mean Tropical Pacific Ocean-Atmosphere Climatology • The Intertropical Convergence Zone (ITCZ) is where the trade winds from the Northern and Southern Hemispheres converge into a narrow belt close to the equator. A result of the general Hadley circulation which dominates the tropics and subtropics.
Mean Tropical Pacific Ocean-Atmosphere Climatology • The winds have two main effects on the tropical Pacific ocean. They cause a general westward motion of surface waters and warmest waters pile up at the western Pacific. • Since the winds are from the NE in the northern tropics and from the SE in the southern tropics, these winds also cause the surface waters in the eastern tropical Pacific to diverge. This divergence causes cold, nutrient-rich subsurface water to upwell at the equator.
West to East SST gradient These two processes cause the tropical Pacific to develop an E-W temperature asymmetry: Warm in the west and cold in the east.
Mean Tropical Pacific Ocean-Atmosphere Climatology • Deep atmospheric convection and heavy rainfall occurs in the western Pacific over the warm water, whereas there is net atmospheric subsidence over the colder water in the eastern Pacific
Mean Tropical Pacific Ocean-Atmosphere Climatology • The rising motions in the west and descending motions in the east establish an E-W atmospheric circulation called the Walker circulation. • Strengthening and weakening of this Walker circulation play a crucial role in reinforcing El Niño/La Niña perturbations to the mean tropical Pacific ocean-atmosphere climatology.
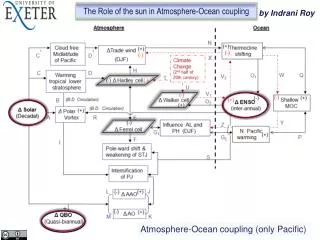
Mean Tropical Pacific Ocean-Atmosphere Climatology • Subtropical/tropical circulation in the Pacific could thus be considered as including two orthogonal, but coupled, components: • (A) Hadley Cell transport crossing latitude lines (towards the equator at the surface and away from the equator in the upper troposphere); and • (B) Walker Cell transport parallel to the equator (westward at the surface and eastward in the upper troposphere).
Mean Tropical Pacific Ocean-Atmosphere Climatology • The combined effect of the Hadley Cell, Walker Cell and rotating earth dynamics is to cause intense convergence and vertical circulation at the ITCZ (near 0° latitude), over both the land and the sea. • Strength of the trade winds varies in phase with the strength of the Walker Cell circulation, and can experience large interannual variations. (ENSO)
The End Members of ENSOLa Nina • Stronger than average trade winds tend to push the warm surface layer of the ocean (upper few 100 meters) towards the western end, creating a thick warm layer (La Nina conditions) • La Nina has higher than average precipitation in Australia, India & Indonesia
The End Members of ENSOEl Nino • Weaker trades relax pressure on surface ocean layer & it starts to move back across Pacific from west to east, raising SST in the eastern tropical water, including Peru (El Nino conditions), with the zone of heavy rains shifting out over the central Pacific islands
Mean Sea Level Pressure Index of ENSO • A widely used index of the strength of the Southern Oscillation, the Southern Oscillation Index (SOI) is given by the normalized difference, SLP at Tahiti - SLP at Darwin. Barometric records at those stations go back to the 1880's. • Both Darwin & Tahiti have an appreciable seasonal cycle of Mean Sea Level Pressure (1933-1992). • Smallest contrast between the two locations occurs in the southern hemisphere autumn, while the highest gradient in MSLP is during the austral summer.
Mean Sea Level Pressure Index of ENSO • Higher positive values of SOI indicate stronger trade winds, especially in the southern hemisphere (La Nina conditions) • For most of the time, mean sea level pressure (MSLP) is relatively high in the south central Pacific (e.g. Tahiti) and MSLP is relatively low over the Indian Ocean and N Australia (e.g. Darwin), with a net transport of air at low latitude from east to west -- the easterly trade winds
Mean Sea Level Pressure Index of ENSO • Every few years the MSLP difference between east and west weakens; consequently the trades relax and there is often drought in India and Australia. Monsoon rainfall correlations to SO were established by mid 1920s • Between 1970 and 1990, there were about four La Nina episodes when high values of SOI persisted for many months, and an equal number of El Nino episodes
SST Index of ENSONino 3 • There is a tight coupling between the SO and eastern equatorial SST -- that is, El Nino. • A time series of Darwin SLP plotted in parallel with a widely used El Nino index called NINO3. (high correlation) • NINO3 is the SST anomaly (departure from normal) averaged over the region 5°N to 5°S and 90°W to 150°W. • Note, that the SOI and NINO3 index are out of phase (different signs).
ENSO Dynamics • Why Does ENSO State Tend to Oscillate? • The short answer is "equatorial ocean dynamics"
ENSO Impacts • How do we know what happens to the global climate during an ENSO event? • Use time series from climate station and perform a correlation analysis. (How many years do we need?) • Plot the result of on a global map and interpret the pattern.
Correlation between the SOI index and land temperature Red = coldduring El Nino Blue = warmduring El Nino
Correlation between the SOI index and land rain fall Red = droughtduring El Nino Blue = rainduring El Nino
The Physics of El Niño The interaction between an east-west sloping upper ocean layer and atmospheric trade winds gives rise to a quasi-periodic seesaw along the equator. The SST, atmospheric flow and equatorial convection are oscillating together (ENSO), affecting vast regions outside the tropical Pacific. The progress made in understanding of ENSO has led to a breakthrough in climate prediction. Source: NOAA/NCEP/CPC
Climate Impacts • Discussion: What economic impacts does ENSO have? • What can we say about ENSO and global climate change? • Are there other phenomena similar to ENSO? • Can we predict ENSO?
Forecasting El Niño with Numerical Models:An Evolving Concept • Observations • of meteorological & ocean conditions in the equatorial Pacific are analyzed and fed into a ... • regional coupled model • of the equatorial Pacific to forecast the evolution of local SST. SST data are fed into a ... • global climate model • to create a probabilistic forecast of the global climate impact. Source: NOAA/PEML Source: IRI
ENSO and global warming NAO ENSO ENSO+NAO observed
Climate and Society • Precipitation • Temperature • CO2 and other gases • Energy • Food • Health • Population dynamics