Download
1 / 8
90 likes | 309 Views
Mapping Forest Canopy Height with MISR.

E N D
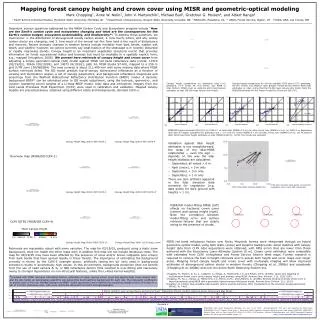
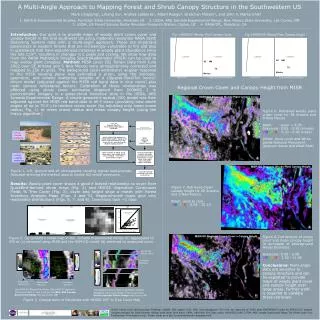
Mapping Forest Canopy Height with MISR We previously demonstrated a capability to obtain physically meaningful canopy structural parameters using data from MISR in a geometric-optical (GO) modeling framework. Assessments against U.S. Forest Service cover and height maps over ~200,000 km2 in New Mexico and Arizona were encouraging (Chopping et al. 2008. Large area mapping of southwestern forest crown cover, canopy height, and biomass using the NASA Multiangle Imaging Spectro-Radiometer, Remote Sensing of Environment 112: 2051-2063). Canopy height is required for estimating aboveground woody biomass, e.g., for quantifying loss and recovery from disturbance. The following slides show how MISR/GO retrievals perform with respect to lidar-derived canopy heights over forest in Colorado. Contact: Mark Chopping (chopping@pegasus.montclair.edu)
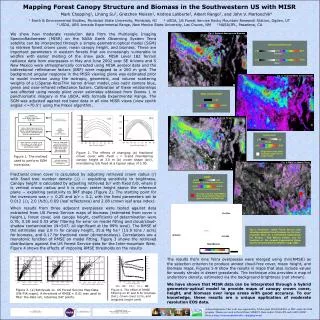
MISR/GO (08/02) vs CLPX* lidar (09/03): Calibration Sites** Sites (1-6: grassland, 7-14: forest) Sites (1-6: grassland, 7-14: forest) MISR/GO height and crown cover retrievals are more accurate with respect toCLPX lidar and orthophoto-based crown cover estimates than Forest Service 2005 Interior Westempirical estimates (based on MODIS VCF/VI, Forest Inventory Analysis, and many other variables). The lidar canopy height estimates were derived from ground and vegetation elevations obtained from a discrete return lidar survey with a spot spacing of ~2 meters. * Cold Land Processes Experiment (http://www.nsidc.org/data/clpx/) ** Sites used to extract background contributions for dynamic background prediction
MISR/GO (08/02) vs CLPX lidar (09/03) Heights: All Sites grassland forest CLPX sites (1-36 are grassland; 37-105 are forest) MISR/GO retrievals are more accurate vs CLPX lidar heights than Forest Service Interior West map empirical estimates. The FS Interior West map (for forest only) misses forest in sites 56-66. MISR/GO anomalies for sites 97-105 are easily screened out as crown cover >> 1.0 (#14 in previous slide).
MISR/GO Results vs GLAS1 Results for Forest Height R2 = 0.71 RMSE = 2.8 m N = 57 MISR over Rocky Mtns GLAS over NE China2 3 Although not strictly comparable, this provides a first indication of respective performances. While the MISR/GO results show bias, waveform lidar height estimates from GLAS typically provide RMSEs of ~3-5 m (accuracy is impacted by topography and varying crown shape). 1 Geoscience Laser Altimeter System on the ICESat platform. 2 Pang et al. 2008, Temperate forest height estimation performance using ICESat GLAS data from different observation periods, International Archives of the Photogrammetry, Remote Sensing and Spatial Information Sciences Vol. XXXVII, Part B7, Beijing 2008, 777-782. 3 Cold Land Processes Experiment (http://www.nsidc.org/data/clpx/)
Rocky Mountain MISR/GO 250 m Height & Crown Cover Maps Fort Collins Fort Collins Denver Denver 0.0 meters 0.99 1 meters 9 10+ 0.0 1.0 Mean Canopy Height Crown Cover clouds Terra orbit 14073 (August 10, 2002). Rectangular areas show where surface retrievals failed; multi-pass compositing on min(inversion_RMSE) can provide wall-to-wall coverage because clouds and contrails result in higher model fitting error (not shown).
Mapping Forest Canopy Height with MISR: Summary • Results are model-based, not empirical fits to data or trained (MISR retrievals are completely independent of the lidar data.) • Good accuracy vs lidar height estimates: RMSE=2.8 m, R2=0.71, N=57. • Low sensitivity to topography; no corrections applied. • Parsimonious: only red band data are required. • Low cost: uses EOS MISR data; global record from 2000. • Rapid: 200,000 km2 @250 m in ~60 minutes, using modest facilities. • The background contribution can/must be calibrated for varying conditions: only one coefficient set required for Rocky Mountain forest. • Limitations: bias apparent; further work is required. • Applications: 2000- baseline crown cover, canopy height, and aboveground biomass records in support of DESDynI; mapping distributions of aboveground woody carbon stocks over large areas; biomass loss and recovery from fire and other disturbance; mapping understory density; corrections for snow cover maps. • Contact: Mark Chopping (chopping@pegasus.montclair.edu)
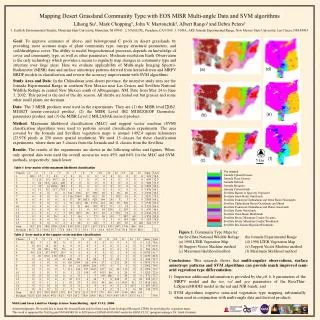
Mapping Forest Height with MISR: General Observations • Limitations: the method is unsuitable for closed canopies, i.e., tropical forest; separate calibrations may be needed for shrubs and forest. • Can map low woody vegetation (shrubs) in addition to forest. • The background estimate is an indicator of understory density. • Model fitting RMSE is sensitive to clouds, even thin cirrus, allowing multi-pass minimum-error compositing to compensate for surface BRF retrieval failures and cloud and cloud shadow contamination. E.g., see the New Mexico/Arizona results in the next slide and Chopping et al. 2008. Large area mapping of southwestern forest crown cover, canopy height, and biomass using the NASA Multiangle Imaging Spectro-Radiometer, Remote Sensing of Environment 112: 2051-2063. • Contact: Mark Chopping (chopping@pegasus.montclair.edu)
MISR/GO vs USFS Map Heights: New Mexico/Arizona N=576, random points, widely distributed. Results composited on minimum model fitting error and filtered for topographic shading.