Download
1 / 20
200 likes | 315 Views
Implementation of forest canopy in the MIUU mesoscale model. Mattias Mohr, Johan Arnqvist, Hans Bergström Uppsala University (Sweden). Project G oals. Project: Wind power over forests ( Vindforsk III) Better estimation of energy yield (wind resource)

E N D
Implementation of forest canopy in the MIUU mesoscale model Mattias Mohr, Johan Arnqvist, Hans Bergström Uppsala University (Sweden)
Project Goals • Project: Wind power over forests (Vindforsk III) • Better estimation of energy yield (wind resource) • Better estimation of turbine loads (wind shear, turbulence, forest clearings) Models should be developed for these purposes
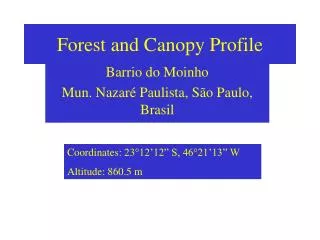
Ryningsnästest site 140m high mast 18m high mast T1, T2 = windturbines
Measurement setup U, T, , Global radiation U, T Sonicane-mometers, LiCor U, T, , q U, T, U, T, q U, T, , Net radiation
MIUU mesoscale model • Used for wind mapping of Sweden (Uppsala University, Weathertech) • Higher order closure, prognostic TKE, no terrain smoothing, 1km resolution (mapping), 100m resolution (forest modelling) • Very high resolution in boundary layer (canopy modelling: 1, 3, 6, 10, 16, 24, 35, 52, … m)
Windprofile over forests • Bulk versuscanopymodelling • Does it make anydifference at allin mesoscalemodels?
Bulk versuscanopymodelling • Resourceassessment benefit? Not sure • Micro-scalesiting benefit? Definitely • In MIUU modelwind-mappingsetup: 5 verticallevelswithinforestanyway, so why not includecanopy?
Howtoincludethis in the model? • Production/dissipation term in TKE equation LAD | horizontal | 3 - | horizontal | q2 whereq2= turbulent kineticenergy(TKE) βp = 1.0 (canopyproductioncoefficient)βd = 4.0 (canopydissipationcoefficient) Seemsto make littledifferenceaboveforest. (Main part of TKE produced by strong windshearaboveforest.)
Drag term for horizontalwindcomponents (u, v) LAD| horizontal | (same for v-component) , = windcomponent Halldin, S. (1985): Leaf and bark area distribution in a pine forest. In The forest atmosphere interaction, edited by B. A. Hutchison and B. B. Hicks (Dordrecht: ReidelPublishing Company), p. 39–58. Lalic, B. and D. T. Mihailovic (2004): An Empirical Relation Describing Leaf-Area Density inside the Forest for Environmental Modeling. Journal of Applied Meteorology, Notes and Correspondence, Vol. 43, p. 641-645.
”Elevated” MoninObukhov (MO) theory in model • Replaceelevation abovegroundwithelevation abovezerodisplacement • Replace MO-similaritytheory terms in forestwithsomethingelse (what?) • Lowerboundaryconditionshaveto be modified (energybalance, u*, … )
Master lengthscale • Lengthscalewithinforest • Simple modelofInoue (1963): l = 0.47 · (h – d) ≈ 2m • Withincanopy: Lengthscaleconstantwithheight Seemstohaveverylittleinfluence on results.
Energy balance • Has to be solved at eachmodellevelwithincanopy • DirectshortwaveradiationfollowsBeer’slawS↓ = S↓0 · exp(-0.5 · ) • Longwaveradiation (Zhao and Qualls, 2006)
Start with idealised 1D simulations • Runseveraldays(diurnalcycle) • Parameters used: 10m/s geostr. wind, averagetemperatureprofile, z0 = 1 m, h = 20 m, LAI = 5, pineforest, spring • Compareresultswith bulk version
Idealised 1D results – diurnal variation m/s No wind in forest
4 day 1D simulation – Input data • Temperatureprofiles from radio soundingsatRyningsnäs • Global radiation from measurements • Geostrophicwinds from Reanalysis • Forest: hc, LAI, LAD(z), zm best guess
4 day 1D simulation - shear • Comparisonofshear exponents (4 days): For comparison (annualvalues) 42 Swedish forest site: 0.25 - 0.40 (median value 0.33) (Source: ”Windpower in forests”, final report, Elforsk, publishedMarch2013)
Summary & Conclusions • Preliminary 1D resultspromising • Still lotofworkto do (lowerboundaryconditions, canopyenergybalance, lengthscale…) • Vertical resolution of 1D runstootime-consuming for 3D runs? • Is vertical resolution of 3D runsenoughfor canopymodel?
Future plans • Refineforestcanopymodule in MIUU model • Implement and run in 3D • Studyeffects on resourceassessment • Implementforestcanopy in WRF