Download
1 / 1
10 likes | 148 Views
0.27. 0.29. 0.89. 0.89. 0.29. 0.01. 0.02. 0.30. 0.00. 10 km. 0.27. shrub non-shrub. --10 km--. 0.30. 0.00. 0.01. tree shrub. 10 km. 0.02. Fractional Cover. Fractional Cover. Rio Grande riparian zone. Summerford San Andres

E N D
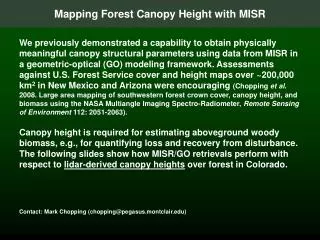
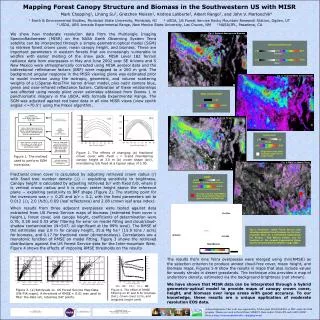
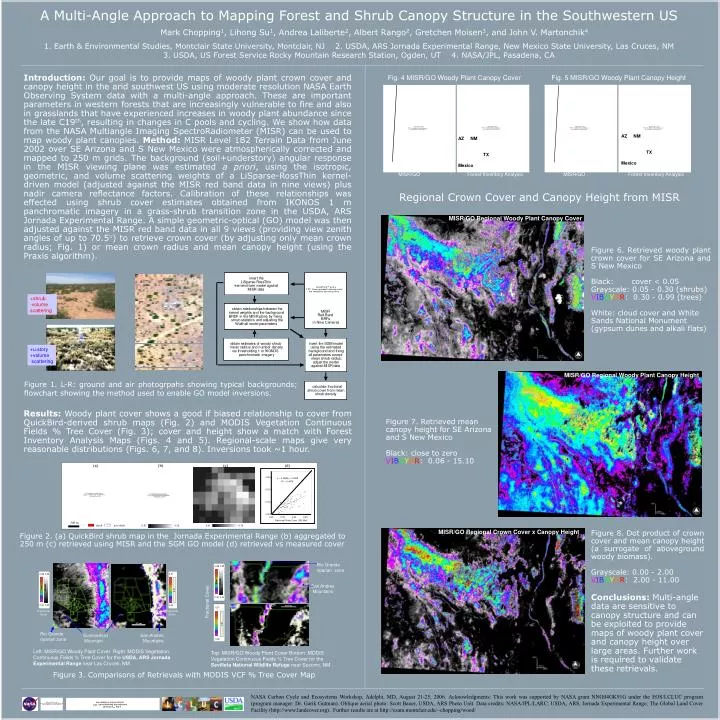
0.27 0.29 0.89 0.89 0.29 0.01 0.02 0.30 0.00 10 km 0.27 shrub non-shrub --10 km-- 0.30 0.00 0.01 tree shrub 10 km 0.02 Fractional Cover Fractional Cover Rio Grande riparian zone Summerford San Andres Mountain Mountains Fig. 4 MISR/GO Woody Plant Canopy Cover Fig. 5 MISR/GO Woody Plant Canopy Height MISR/GO Regional Woody Plant Canopy Cover AZ NM TX Mexico AZ NM TX Mexico white=cloud cover and White Sands National Monument +shrub -volume scattering MISR/GO Forest Inventory Analysis MISR/GO Forest Inventory Analysis +u.story +volume scattering MISR/GO Regional Woody Plant Canopy Height Figure 1. L-R: ground and air photogrpahs showing typical backgrounds; flowchart showing the method used to enable GO model inversions. 0.01 0.03 0.18 0.30 (a) (b) (c) (d) 500 m MISR/GO Regional Crown Cover x Canopy Height Figure 2. (a) QuickBird shrub map in the Jornada Experimental Range (b) aggregated to 250 m (c) retrieved using MISR and the SGM GO model (d) retrieved vs measured cover Rio Grande riparian zone tree shrub San Andres Mountains Fractional Cover Top: MISR/GO Woody Plant Cover Bottom: MODIS Vegetation Continuous Fields % Tree Cover for the Sevilleta National Wildlife Refuge near Socorro, NM Left: MISR/GO Woody Plant Cover Right: MODIS Vegetation Continuous Fields % Tree Cover for the USDA, ARS Jornada Experimental Range near Las Cruces, NM Figure 3. Comparisons of Retrievals with MODIS VCF % Tree Cover Map A Multi-Angle Approach to Mapping Forest and Shrub Canopy Structure in the Southwestern US Mark Chopping1, Lihong Su1, Andrea Laliberte2, Albert Rango2, Gretchen Moisen3, and John V. Martonchik4 Earth & Environmental Studies, Montclair State University, Montclair, NJ 2. USDA, ARS Jornada Experimental Range, New Mexico State University, Las Cruces, NM 3. USDA, US Forest Service Rocky Mountain Research Station, Ogden, UT 4. NASA/JPL, Pasadena, CA Introduction: Our goal is to provide maps of woody plant crown cover and canopy height in the arid southwest US using moderate resolution NASA Earth Observing System data with a multi-angle approach. These are important parameters in western forests that are increasingly vulnerable to fire and also in grasslands that have experienced increases in woody plant abundance since the late C19th, resulting in changes in C pools and cycling. We show how data from the NASA Multiangle Imaging SpectroRadiometer (MISR) can be used to map woody plant canopies. Method: MISR Level 1B2 Terrain Data from June 2002 over SE Arizona and S New Mexico were atmospherically corrected and mapped to 250 m grids. The background (soil+understory) angular response in the MISR viewing plane was estimated a priori, using the isotropic, geometric, and volume scattering weights of a LiSparse-RossThin kernel-driven model (adjusted against the MISR red band data in nine views) plus nadir camera reflectance factors. Calibration of these relationships was effected using shrub cover estimates obtained from IKONOS 1 m panchromatic imagery in a grass-shrub transition zone in the USDA, ARS Jornada Experimental Range. A simple geometric-optical (GO) model was then adjusted against the MISR red band data in all 9 views (providing view zenith angles of up to 70.5°) to retrieve crown cover (by adjusting only mean crown radius; Fig. 1) or mean crown radius and mean canopy height (using the Praxis algorithm). Regional Crown Cover and Canopy Height from MISR Figure 6. Retrieved woody plant crown cover for SE Arizona and S New Mexico Black: cover < 0.05 Grayscale: 0.05 - 0.30 (shrubs) VIBGYOR: 0.30 - 0.99 (trees) White: cloud cover and White Sands National Monument (gypsum dunes and alkali flats) Results: Woody plant cover shows a good if biased relationship to cover from QuickBird-derived shrub maps (Fig. 2) and MODIS Vegetation Continuous Fields % Tree Cover (Fig. 3); cover and height show a match with Forest Inventory Analysis Maps (Figs. 4 and 5). Regional-scale maps give very reasonable distributions (Figs. 6, 7, and 8). Inversions took ~1 hour. Figure 7. Retrieved mean canopy height for SE Arizona and S New Mexico Black: close to zero VIBGYOR: 0.06 - 15.10 Figure 8. Dot product of crown cover and mean canopy height (a surrogate of aboveground woody biomass). Grayscale: 0.00 - 2.00 VIBGYOR: 2.00 - 11.00 Conclusions: Multi-angle data are sensitive to canopy structure and can be exploited to provide maps of woody plant cover and canopy height over large areas. Further work is required to validate these retrievals. NASA Carbon Cycle and Ecosystems Workshop, Adelphi, MD, August 21-25, 2006. Acknowledgments: This work was supported by NASA grant NNG04GK91G under the EOS/LCLUC program (program manager: Dr. Garik Gutman). Oblique aerial photo: Scott Bauer, USDA, ARS Photo Unit. Data credits: NASA/JPL/LARC; USDA, ARS, Jornada Experimental Range; The Global Land Cover Facility (http://www.landcover.org). Further results are at http://csam.montclair.edu/~chopping/wood/