Download
1 / 23
230 likes | 429 Views
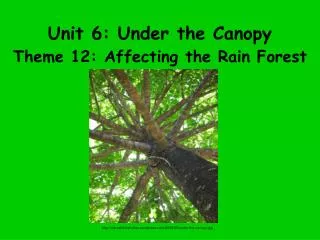
Modelling of light transmission under heterogeneous forest canopy. Da SILVA David , BALANDIER Philippe, BOUDON Frédéric, André MARQUIER, Christophe PRADAL, Christophe GODIN, SINOQUET Hervé. Understorey microclimate : Light, temperature, air humidity, ….

E N D
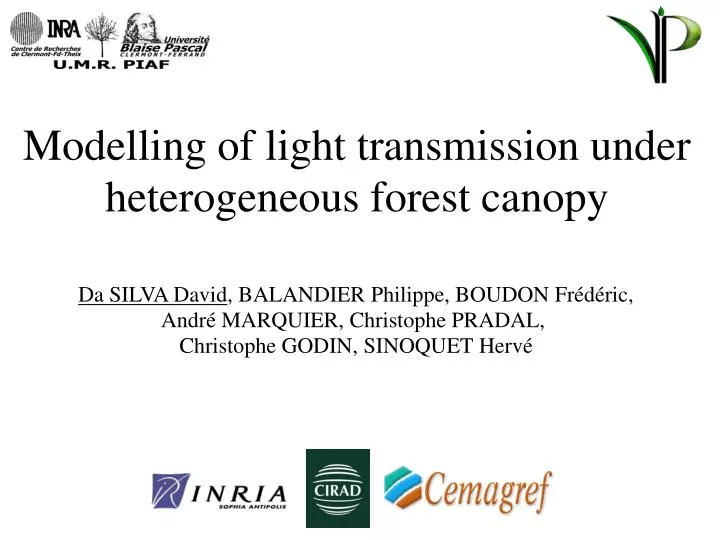
Modelling of light transmission under heterogeneous forest canopy Da SILVA David, BALANDIER Philippe, BOUDON Frédéric, André MARQUIER, Christophe PRADAL, Christophe GODIN, SINOQUET Hervé
Understorey microclimate : Light, temperature, air humidity, … Flora, wildlife, regeneration saplings Soil biological activity, humus Soil water, soil temperature Light influence Transmited irradiance
Regeneration Larch stands, France and Belgium [Balandier et al., Forestry, 2006] Understorey developement Maximum biodiversity Classical forest flora Relative Biodiversity Invasion by competitives species Bare soil 0 10 20 30 40 50 Transmittance (%)
Objectives • Determine a minimal set of simple measurements to obtain satisfactory light transmission classes • Basal area • Height • Closest neighbour distance • General model • Coarse or detailed parametrization • Mono or multi-scale • Output : light transmission classes
Method • Model developement • Starting from detailed description of stand at tree scale • Sensitivity analysis • spatial distribution, clustering • size of tree crown • shape and orientation of tree crown • Simplify the measures requirement
Light interception model • Porous envelope based • Fraction of light intercepted is related to the crown projection area and its envelope projection area in the direction x 0.93 =
Known positions Uniform distribution [Sinoquet et al., 2005] Light interception model • Crown discretization using regularly spaced beams • Beam opacity evaluation according to components distribution hypothesis
Buffer zone, no light measurement Interest zone 64 PAR sensor grid Tree height Tree height Experimental unit • Light measurements : • PAR sensors • Hemispherical photos • Dendrometric measures : • X, Y positions • Total height • Base crown height • DBH (diameter at breast height) • 4 to 8 crown radii
Light measurements Grid of PAR Sensor [Chaboche K., 2006] Full light reference
Crowns opacity Thresholding and pixel count using PiafPhotem [UMR Piaf, INRA, Clermont-Ferrand] Tree opacity = 93,5%
Crown reconstruction using Skinned Surfaces Constructed from different profiles
Stand reconstruction 3D tree reconstruction using height informations Fitting the hulls to measured radii
Computing direct & diffuse incident light • Direct light depending on latitude, longitude, julian day, time step, start and stop hour • Diffuse light simulated by 46 directions of Turtle Sky [Den Dulk 89]
Simulation steps Weighted merging according to elevation [Campbell G.S. and Norman J.M., 1998]
Combining direct and diffuse Image are merged using PDIF ratio (diffuse PPFD / diffuse+direct PPFD)
Simulation Tree opacity = 93.5% Mean : 48.972 Std : 8.071 Extracting interest zone information
Simulation Measures Tree opacity = 93.5% Mean : 38.081 Std : 9.455 Mean : 48.972 Std : 8.071 Calibration • Ongoing work • First results for one stand • Unsuficient edge • Unique opacity
Measures Simulation Tree opacity = 93.5% Mean : 38.081 Std : 9.455 Mean : 42.68 Std : 12.08 Stand replication
Calibration options • Duplicates positioning and/or introducing randomness • Use of porous wall as calibrating device • LAD determination to take beam travel distance in crown into account • Usage of the multi-scale possibilities of the model
Known positions Uniform distribution [Sinoquet et al., 2005] Multi-scale light interception model
Perspectives(after calibration…) • Stand type caracterization [Marie-Ange NgoBieng, 2007] • Simulation of n stands • Variability caracterization • Sensitivity analysis • Spatial distribution • Crown shape • Intra and inter-tree clustering • Determination of descriptors of main interest
Virtual Plants team CHAUBERT Florence CHOPARD Jérôme STOMA Szymon UMR Piaf DONES Nicolas Acknowledgment ANR Project ECOGER “Bases of mixed stands sustainable management of mixed stands: ecophysiology, growth and demogenetics of constitutive species.” Collaboration between INRA, the French National forestry commission and CEMAGREF