Download
1 / 6
60 likes | 177 Views
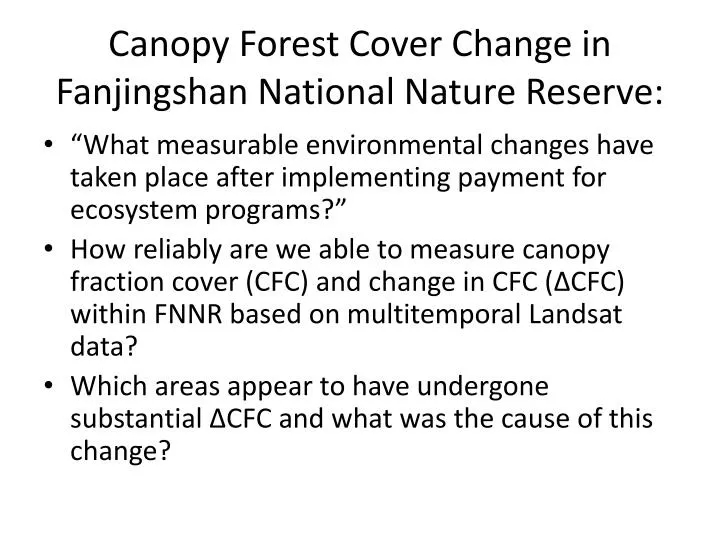
Canopy Forest Cover Change in Fanjingshan National Nature Reserve:. “What measurable environmental changes have taken place after implementing payment for ecosystem programs?”

E N D
Canopy Forest Cover Change in Fanjingshan National Nature Reserve: • “What measurable environmental changes have taken place after implementing payment for ecosystem programs?” • How reliably are we able to measure canopy fraction cover (CFC) and change in CFC (ΔCFC) within FNNR based on multitemporalLandsat data? • Which areas appear to have undergone substantial ΔCFC and what was the cause of this change?
Satellite Data • Landsat TM/ETM+ for May 2000 and April 2009 • RapidEye multispectral image data for Dec 2009 • High spatial resolution imagery for 2014 • Start building Landsat 8 OLI time series
Canopy Fractional Cover (CFC) V = Vegetation index (e.g., MSAVI) pixel = given Landsat pixel canopy = 100% canopy endmember open = 100% bare ground endmember
Analyses • Explore effects of different radiometric normalization (PIF and histogram matching) • Explore sensitivity to different canopy and open endmembers • Compare indirect and direct ΔCFC mapping approaches • Examine spatial distribution and apparent causes of ΔCFC
Landsat TM Red (x axis) and NIR (y axis) feature space May 2000 (left) and April 2009 (right)