Download
1 / 1
10 likes | 159 Views
area enlarged in maps to the right. Fort Collins. Denver. Validation against lidar height estimates is not straightforward: the slope of the lidar-MISR relationship -- even the sign -- depends on the way the lidar height statistics are calculated: September, all values > 0 m

E N D
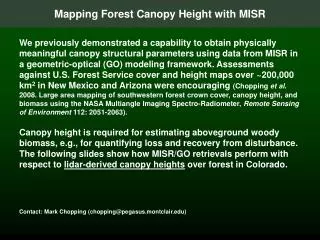
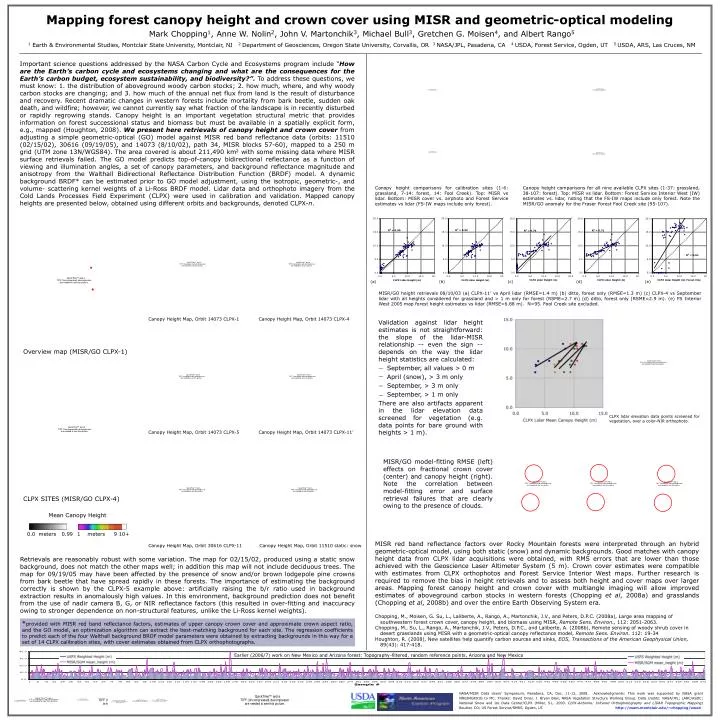
area enlarged in maps to the right Fort Collins Denver Validation against lidar height estimates is not straightforward: the slope of the lidar-MISR relationship -- even the sign -- depends on the way the lidar height statistics are calculated: September, all values > 0 m April (snow), > 3 m only September, > 3 m only September, > 1 m only There are also artifacts apparent in the lidar elevation data screened for vegetation (e.g. data points for bare ground with heights > 1 m). North Park Rabbit Ears Fraser Mean Canopy Height 1 meters 9 10+ 0.0 meters 0.99 Mapping forest canopy height and crown cover using MISR and geometric-optical modeling Mark Chopping1, Anne W. Nolin2, John V. Martonchik3, Michael Bull3, Gretchen G. Moisen4, and Albert Rango5 1 Earth & Environmental Studies, Montclair State University, Montclair, NJ 2 Department of Geosciences, Oregon State University, Corvallis, OR 3 NASA/JPL, Pasadena, CA 4 USDA, Forest Service, Ogden, UT 5 USDA, ARS, Las Cruces, NM Important science questions addressed by the NASA Carbon Cycle and Ecosystems program include “How are the Earth’s carbon cycle and ecosystems changing and what are the consequences for the Earth’s carbon budget, ecosystem sustainability, and biodiversity?”. To address these questions, we must know: 1. the distribution of aboveground woody carbon stocks; 2. how much, where, and why woody carbon stocks are changing; and 3. how much of the annual net flux from land is the result of disturbance and recovery. Recent dramatic changes in western forests include mortality from bark beetle, sudden oak death, and wildfire; however, we cannot currently say what fraction of the landscape is in recently disturbed or rapidly regrowing stands. Canopy height is an important vegetation structural metric that provides information on forest successional status and biomass but must be available in a spatially explicit form, e.g., mapped (Houghton, 2008). We present hereretrievals of canopy height and crown cover from adjusting a simple geometric-optical (GO) model against MISR red band reflectance data (orbits: 11510 (02/15/02), 30616 (09/19/05), and 14073 (8/10/02), path 34, MISR blocks 57-60), mapped to a 250 m grid (UTM zone 13N/WGS84). The area covered is about 211,490 km2 with some missing data where MISR surface retrievals failed. The GO model predicts top-of-canopy bidirectional reflectance as a function of viewing and illumination angles, a set of canopy parameters, and background reflectance magnitude and anisotropy from the Walthall Bidirectional Reflectance Distribution Function (BRDF) model. A dynamic background BRDF* can be estimated prior to GO model adjustment, using the isotropic, geometric-, and volume- scattering kernel weights of a Li-Ross BRDF model. Lidar data and orthophoto imagery from the Cold Lands Processes Field Experiment (CLPX) were used in calibration and validation. Mapped canopy heights are presented below, obtained using different orbits and backgrounds, denoted CLPX-n. Canopy height comparisons for calibration sites (1-6: grassland, 7-14: forest, 14: Fool Creek). Top: MISR vs lidar. Bottom: MISR cover vs. airphoto and Forest Service estimates vs lidar (FS-IW maps include only forest). Canopy height comparisons for all nine available CLPX sites (1-37: grassland, 38-107: forest). Top: MISR vs lidar. Bottom: Forest Service Interior West (IW) estimates vs. lidar, noting that the FS-IW maps include only forest. Note the MISR/GO anomaly for the Fraser Forest Fool Creek site (95-107). (a) (b) (c) (d) (e) MISR/GO height retrievals 08/10/03 (a) CLPX-11’ vs April lidar (RMSE=1.4 m) (b) ditto, forest only (RMSE=1.3 m) (c) CLPX-4 vs September lidar with all heights considered for grassland and > 1 m only for forest (RSME=2.7 m) (d) ditto, forest only (RSME=2.9 m). (e) FS Interior West 2005 map forest height estimates vs lidar (RMSE=6.88 m). N=95. Fool Creek site excluded. Canopy Height Map, Orbit 14073 CLPX-1 Canopy Height Map, Orbit 14073 CLPX-4 Overview map (MISR/GO CLPX-1) CLPX lidar elevation data points screened for vegetation, over a color-NIR orthophoto. Canopy Height Map, Orbit 14073 CLPX-5 Canopy Height Map, Orbit 14073 CLPX-11’ MISR/GO model-fitting RMSE (left) effects on fractional crown cover (center) and canopy height (right). Note the correlation between model-fitting error and surface retrieval failures that are clearly owing to the presence of clouds. CLPX SITES (MISR/GO CLPX-4) MISR red band reflectance factors over Rocky Mountain forests were interpreted through an hybrid geometric-optical model, using both static (snow) and dynamic backgrounds. Good matches with canopy height data from CLPX lidar acquisitions were obtained, with RMS errors that are lower than those achieved with the Geoscience Laser Altimeter System (5 m). Crown cover estimates were compatible with estimates from CLPX orthophotos and Forest Service Interior West maps. Further research is required to remove the bias in height retrievals and to assess both height and cover maps over larger areas. Mapping forest canopy height and crown cover with multiangle imaging will allow improved estimates of aboveground carbon stocks in western forests (Chopping et al, 2008a) and grasslands (Chopping et al, 2008b) and over the entire Earth Observing System era. Canopy Height Map, Orbit 30616 CLPX-11 Canopy Height Map, Orbit 11510 static: snow Retrievals are reasonably robust with some variation. The map for 02/15/02, produced using a static snow background, does not match the other maps well; in addition this map will not include deciduous trees. The map for 09/19/05 may have been affected by the presence of snow and/or brown lodgepole pine crowns from bark beetle that have spread rapidly in these forests. The importance of estimating the background correctly is shown by the CLPX-5 example above: artificially raising the b/r ratio used in background extraction results in anomalously high values. In this environment, background prediction does not benefit from the use of nadir camera B, G, or NIR reflectance factors (this resulted in over-fitting and inaccuracy owing to stronger dependence on non-structural features, unlike the Li-Ross kernel weights). Chopping, M., Moisen, G. Su, L., Laliberte, A., Rango, A., Martonchik, J.V., and Peters, D.P.C. (2008a), Large area mapping of southwestern forest crown cover, canopy height, and biomass using MISR, Remote Sens. Environ., 112: 2051-2063. Chopping, M., Su, L., Rango, A., Martonchik, J.V., Peters, D.P.C., and Laliberte, A. (2008b), Remote sensing of woody shrub cover in desert grasslands using MISR with a geometric-optical canopy reflectance model, Remote Sens. Environ. 112: 19-34 Houghton, R. (2008), New satellites help quantify carbon sources and sinks, EOS, Transactions of the American Geophysical Union, 89(43): 417-418. *provided with MISR red band reflectance factors, estimates of upper canopy crown cover and approximate crown aspect ratio, and the GO model, an optimization algorithm can extract the best-matching background for each site. The regression coefficients to predict each of the four Walthall background BRDF model parameters were obtained by extracting backgrounds in this way for a set of 14 CLPX calibration sites, with cover estimates obtained from CLPX orthophotographs. Earlier (2006/7) work on New Mexico and Arizona forest: Topography-filtered, random reference points, Arizona and New Mexico NASA/MISR Data Users’ Symposium, Pasadena, CA, Dec. 11-12, 2008. Acknowledgments: This work was supported by NASA grant NNG04GK91G to MC. Thanks: David Diner, J. Bryan Blair, NASA Vegetation Structure Working Group. Data credits: NASA/JPL; LARC/ASDC; National Snow and Ice Data Center/CLPX (Miller, S.L. 2003. CLPX-Airborne: Infrared Orthophotography and LIDAR Topographic Mapping) Boulder, CO; US Forest Service/RMRS, Ogden, UT. http://csam.montclair.edu/~chopping/wood