Download

1 / 53
540 likes | 609 Views
Supply. Outline. I. Law of Supply II. Supply Schedules and Supply Curves A. Supply Schedules B. Supply Curves C. Market Supply. Outline (Cont.). III. Change in Supply vs. Change in Quantity Supplied A. Change in Supply B. Change in Quantity Supplied. What is Supply?.

E N D
Outline I. Law of Supply II. Supply Schedules and Supply Curves A. Supply Schedules B. Supply Curves C. Market Supply
Outline (Cont.) III. Change in Supply vs. Change in Quantity Supplied A. Change in Supply B. Change in Quantity Supplied
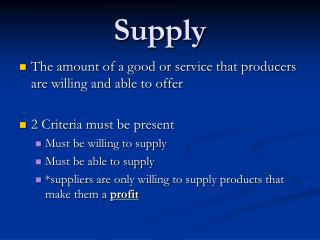
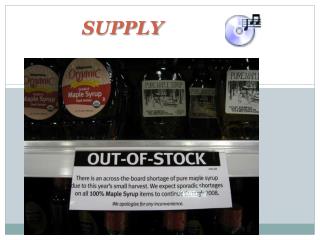
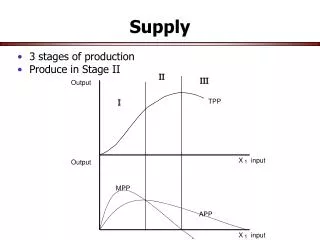
What is Supply? • Supply is how much a firm is willing to sell at every given price, ceteris paribus • Thus, if all else remains the same and the price of a good goes up, what would you expect the response of a firm to be? • To produce more, since prices are going up, so will profits
Law of Supply • Law of Supply - the price of a product (or service) is directly related to the quantity supplied, ceteris paribus. • Quantity Supplied - the amount of a good (or service) produced by firms at a particular price. • While demand typically refers to consumers, supply typically refers to firms.
Supply Schedules and Curves • Just like we were able to construct a Demand Schedule and Demand Curve, we will do the same for Supply • Supply Schedule - a table showing the relationship between the price of a good and the quantity supplied per period of time, ceteris paribus.
Supply Schedules and Curves • Supply Curve - a diagram showing the relationship between the price of a good and the quantity supplied per period of time, ceteris paribus.
Supply Curve P($) Remember to ALWAYS label your axes! Qs per month
Supply Curve P($) 20 15 10 5 Qs per month 0 5 10 15
Supply Curve P($) A 20 15 10 5 Qs per month 0 5 10 15
Supply Curve P($) A 20 B 15 10 5 Qs per month 0 5 10 15
Supply Curve P($) A 20 B 15 10 C 5 Qs per month 0 5 10 15
Supply Curve P($) S A 20 B 15 10 C 5 Qs per month 0 5 10 15
Market Supply Curve • Market Supply Curve - a curve showing the relationship between the price of a good and the total quantity supplied by all firms in the market per period of time, ceteris paribus. • Market supply curves are obtained by summing the supply curves of individual firms.
Market Supply Schedule • Market Supply Schedule - a table showing the relationship between the price of a good and the total quantity supplied by all firms in the market per period of time, ceteris paribus. • Market supply schedules are obtained by summing the supply curves of individual firms.
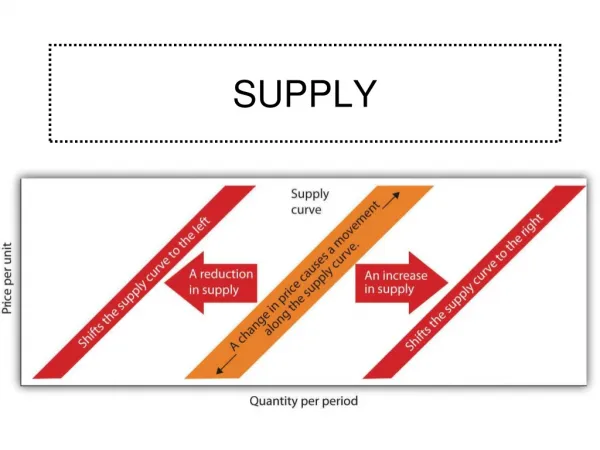
Change in S vs. Change in Qs • Change in Supply - a shift of the supply curve • A supply curve is drawn under the assumption of ceteris paribus. • When this assumption is relaxed, the entire supply curves shifts
Change in S vs. Change in Qs • Changes in Supply • Increase in supply - supply curve shifts to the right • Decrease in supply - supply curve shifts to the left
Change in Supply Factors Which Cause a Change in Supply • Prices of Relevant Resources • Technology • Number of Sellers • Expectations of Future Price • Taxes and Subsidies • Changes in the Availability of Credit
Price of Relevant Resources • Let’s say the cost of plastic (used in making CDs) decreases • It is now cheaper to make every quantity of CDs
Resource Price Decrease • So, before the cost decrease, at a price of $20 the firm was willing to make 15 CDs. If costs go down, will the firm still need $20 to make them want to supply 15 CDs? • No, in order to make the same profit they are willing to take a lower price
Supply Curve P($) A 20 15 A’ 10 5 Qs per month 0 5 10 15
Resource Price Decrease • Thus the firm is willing to supply every quantity at a lower price. • Or in other words, at every price the firm is willing to supply more of the good • In summary, if the price of a resource goes down, supply increases (shifts to the right)
Supply Curve Shift Old Supply Curve P($) A 20 15 A’ New Supply Curve 10 5 Qs per month 0 5 10 15
Price of Relevant Resources • Let’s say the cost of plastic (used in making CDs) increases • It is now more expensive to make every quantity of CDs
Resource Price Decrease • So, before the cost increase, at a price of $15 the firm was willing to make 7 CDs. If costs go up, will the firm still need $15 to make them want to supply 7 CDs? • No, in order to make the same profit they are going to need a higher price to cover the higher costs
Supply Curve P($) B’ 20 B 15 10 5 Qs per month 0 5 10 15
Resource Price Decrease • Thus the firm is willing to supply every quantity at a higher price. • Or in other words, at every price the firm is willing to supply less of the good • In summary, if the price of a resource goes up, supply decreases (shifts to the left)
Supply Curve Shift New Supply Curve P($) Old Supply Curve B’ 20 B 15 10 5 Qs per month 0 5 10 15
Technology • Improvement in technology lowers costs • Lower cost of production increases Supply • Worsening of technology increases costs • Higher cost of production decreases Supply
Number of Sellers • More sellers in the market means more quantity is being supplied at every price • Increase in supply of the good • Less sellers in the market means less quantity is being supplied at every price • Decrease supply of the good
Expectations of Future Prices • Firms expect price of their good to decrease in the future • Supply increases today • Firm would prefer to sell today when price is higher
Expectations of Future Prices • Firms expect price of their good to increase in the future • Supply decreases today • Firm would prefer to wait until the good can be sold for a higher price
Taxes and Subsidies • Increase in tax on the good decreases supply • Raises the cost of production • Decrease in tax on the good increases supply • Lowers the cost of production
Taxes and Subsidies • A subsidy is an amount the paid to the producer for each unit of a good produced • Increase in Subsidy on the Good Increases Supply • Lowers the costs of production • Decrease in Subsidy on the Good Decreases Supply • Raises the costs of production
Availability of Credit • If it is easier for the firm to borrow money, the firm will be able to produce more • Thus Supply increases • If it is more difficult for the firm to borrow money, the firm will have to produce less • Thus Supply decreases
Change in Quantity Supplied • Change in Quantity Supplied (DQs) - movement along a supply curve • A change in quantity supplied can only be caused by a change in the price of the good. • Changes in Quantity Supplied • Increase in Qs - a movement to the right along a supply curve • Decrease in Qs - a movement to the left along a supply curve
Increase in Supply P Qs
Increase in Supply S P Qs
Increase in Supply S P Qs
Increase in Supply S P S’ Qs
Increase in Qs P($) Qs per month
Increase in Qs S P($) Qs per month