Download
1 / 1
10 likes | 88 Views
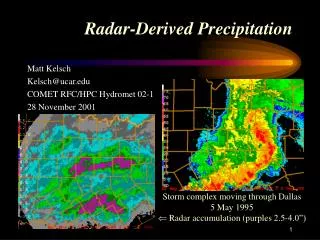
Continuing research on radar-observed precipitation systems during NAME 2004 Timothy J. Lang, Stephen W. Nesbitt, Steven A. Rutledge, Robert Cifelli, David Lerach, Lee Nelson, Gustavo Pereira, and Angela Rowe Colorado State University, Fort Collins, CO David A. Ahijevych and Richard E. Carbone

E N D
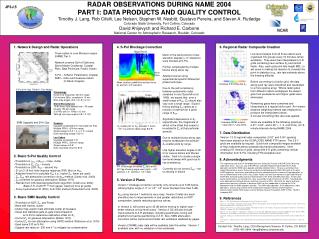
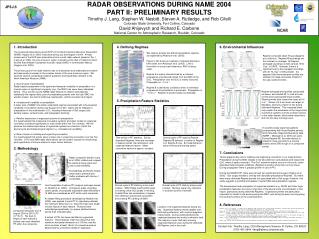
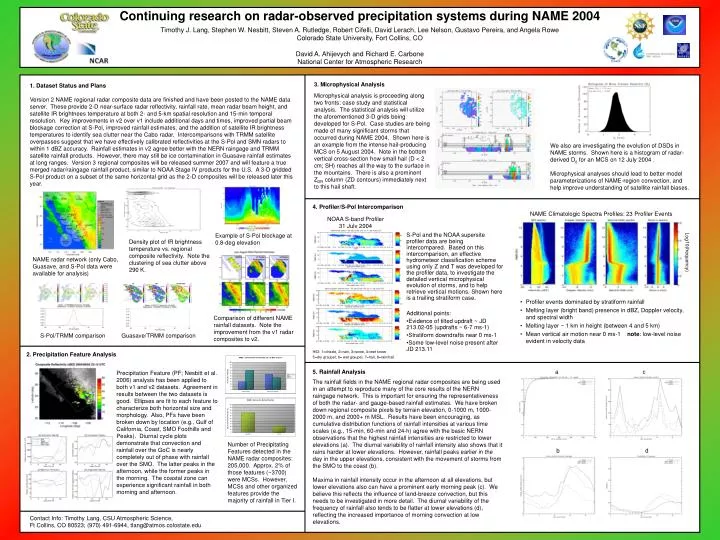
Continuing research on radar-observed precipitation systems during NAME 2004 Timothy J. Lang, Stephen W. Nesbitt, Steven A. Rutledge, Robert Cifelli, David Lerach, Lee Nelson, Gustavo Pereira, and Angela Rowe Colorado State University, Fort Collins, CO David A. Ahijevych and Richard E. Carbone National Center for Atmospheric Research 3. Microphysical Analysis 1. Dataset Status and Plans Version 2 NAME regional radar composite data are finished and have been posted to the NAME data server. These provide 2-D near-surface radar reflectivity, rainfall rate, mean radar beam height, and satellite IR brightnees temperature at both 2- and 5-km spatial resolution and 15-min temporal resolution. Key improvements in v2 over v1 include additional days and times, improved partial beam blockage correction at S-Pol, improved rainfall estimates, and the addition of satellite IR brightness temperatures to identify sea clutter near the Cabo radar. Intercomparisons with TRMM satellite overpasses suggest that we have effectively calibrated reflectivities at the S-Pol and SMN radars to within 1 dBZ accuracy. Rainfall estimates in v2 agree better with the NERN raingage and TRMM satellite rainfall products. However, there may still be ice contamination in Guasave rainfall estimates at long ranges. Version 3 regional composites will be released summer 2007 and will feature a true merged radar/raingage rainfall product, similar to NOAA Stage IV products for the U.S. A 3-D gridded S-Pol product on a subset of the same horizontal grid as the 2-D composites will be released later this year. Microphysical analysis is proceeding along two fronts: case study and statistical analysis. The statistical analysis will utilize the aforementioned 3-D grids being developed for S-Pol. Case studies are being made of many significant storms that occurred during NAME 2004. Shown here is an example from the intense hail-producing MCS on 5 August 2004. Note in the bottom vertical cross-section how small hail (D < 2 cm; SH) reaches all the way to the surface in the mountains. There is also a prominent ZDR column (ZD contours) immediately next to this hail shaft. We also are investigating the evolution of DSDs in NAME storms. Shown here is a histogram of radar-derived D0 for an MCS on 12 July 2004 . Microphysical analyses should lead to better model parameterizations of NAME-region convection, and help improve understanding of satellite rainfall biases. 4. Profiler/S-Pol Intercomparison NAME Climatologic Spectra Profiles: 23 Profiler Events NOAA S-band Profiler 31 July 2004 Example of S-Pol blockage at 0.8-deg elevation • S-Pol and the NOAA supersite profiler data are being intercompared. Based on this intercomparison, an effective hydrometeor classification scheme using only Z and T was developed for the profiler data, to investigate the detailed vertical microphysical evolution of storms, and to help retrieve vertical motions. Shown here is a trailing stratiform case. • Additional points: • Evidence of tilted updraft ~ JD 213.02-05 (updrafts ~ 6-7 ms-1) • Stratiform downdrafts near 0 ms-1 • Some low-level noise present after JD 213.11 Density plot of IR brightness temperature vs. regional composite reflectivity. Note the clustering of sea clutter above 290 K. Log10(frequency) NAME radar network (only Cabo, Guasave, and S-Pol data were available for analysis) • Profiler events dominated by stratiform rainfall • Melting layer (bright band) presence in dBZ, Doppler velocity, and spectral width • Melting layer ~ 1 km in height (between 4 and 5 km) • Mean vertical air motion near 0 ms-1 note: low-level noise evident in velocity data Comparison of different NAME rainfall datasets. Note the improvement from the v1 radar composites to v2. S-Pol/TRMM comparison Guasave/TRMM comparison HID: 1=drizzle, 2=rain, 3=snow, 4=wet snow, 5=dry graupel, 6= wet graupel, 7=hail, 8=rain/hail 2. Precipitation Feature Analysis 5. Rainfall Analysis a c Precipitation Feature (PF; Nesbitt et al. 2006) analysis has been applied to both v1 and v2 datasets. Agreement in results between the two datasets is good. Ellipses are fit to each feature to characterize both horizontal size and morphology. Also, PFs have been broken down by location (e.g., Gulf of California, Coast, SMO Foothills and Peaks). Diurnal cycle plots demonstrate that convection and rainfall over the GoC is nearly completely out of phase with rainfall over the SMO. The latter peaks in the afternoon, while the former peaks in the morning. The coastal zone can experience significant rainfall in both morning and afternoon. The rainfall fields in the NAME regional radar composites are being used in an attempt to reproduce many of the core results of the NERN raingage network. This is important for ensuring the representativeness of both the radar- and gauge-based rainfall estimates. We have broken down regional composite pixels by terrain elevation, 0-1000 m, 1000-2000 m, and 2000+ m MSL. Results have been encouraging, as cumulative distribution functions of rainfall intensities at various time scales (e.g., 15-min, 60-min and 24-h) agree with the basic NERN observations that the highest rainfall intensities are restricted to lower elevations (a). The diurnal variability of rainfall intensity also shows that it rains harder at lower elevations. However, rainfall peaks earlier in the day in the upper elevations, consistent with the movement of storms from the SMO to the coast (b). Maxima in rainfall intensity occur in the afternoon at all elevations, but lower elevations also can have a prominent early morning peak (c). We believe this reflects the influence of land-breeze convection, but this needs to be investigated in more detail. The diurnal variability of the frequency of rainfall also tends to be flatter at lower elevations (d), reflecting the increased importance of morning convection at low elevations. Number of Precipitating Features detected in the NAME radar composites: 205,000. Approx. 2% of those features (~3700) were MCSs. However, MCSs and other organized features provide the majority of rainfall in Tier I. b d Contact Info: Timothy Lang, CSU Atmospheric Science, Ft Collins, CO 80523; (970) 491-6944, tlang@atmos.colostate.edu