Download
1 / 1
10 likes | 149 Views
RADAR OBSERVATIONS DURING NAME 2004 PART I: DATA PRODUCTS AND QUALITY CONTROL Timothy J. Lang, Rob Cifelli, Lee Nelson, Stephen W. Nesbitt, Gustavo Pereira, and Steven A. Rutledge Colorado State University, Fort Collins, Colorado David Ahijevych and Richard E. Carbone

E N D
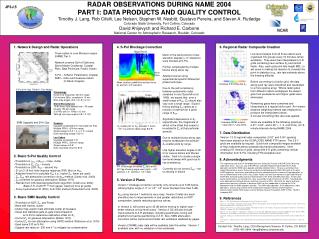
RADAR OBSERVATIONS DURING NAME 2004 PART I: DATA PRODUCTS AND QUALITY CONTROL Timothy J. Lang, Rob Cifelli, Lee Nelson, Stephen W. Nesbitt,Gustavo Pereira, and Steven A. Rutledge Colorado State University, Fort Collins, Colorado David Ahijevych and Richard E. Carbone National Center for Atmospheric Research, Boulder, Colorado JP3J.5 1. Network Design and Radar Operations 4. S-Pol Blockage Correction 6. Regional Radar Composite Creation Major Blocks Three radars in core Monsoon region (NAME Tier I) Network covered Gulf of California, Sierra Madre Occidental, Coastal Plain, Baja Peninsula, Pacific Ocean S-Pol – S-Band, Polarimetric, Doppler SMN – Cabo and Guasave radars (C-Band, Doppler) Low-level sweeps from all three radars were organized into groups every 15 minutes (when available). They were then interpolated to 2-D grids containing near-surface ZH and rainfall fields. Also, each grid point lists height MSL, to aid users in making the decision to consider the point in statistics (e.g., rain rate estimate above the freezing altitude). Before converting to a lat/lon grid, the data along each ray were smoothed and resampled to a more sparse array. Where radar gates from different radars overlapped, the lowest gate took precedence and higher gates were eliminated. Remaining gates were combined and interpolated to a regular lat/lon grid. An inverse-distance weighting method was employed to produce the interpolated values. A circular smoothing filter also was applied. Grids are available at the following spacings: 0.01º, 0.02°, and 0.05° (~1, 2, and 5 km), at 15-minute intervals during NAME 2004. Much of the land portions of low-elevation sweeps (< 2° elevation) were blocked at S-Pol. Further complicated by multiple blocks along same ray. Attempt recover using experimental specific differential phase technique. Due to the self-consistency between polarimetric radar variables in rain (Scarchilli et al. 1996), we expect that, over a small range of KDP, ZH should also vary over a small range. Exploit this by plotting ZH values as a function of azimuth for a given range of KDP. Significant depressions in ZH signal blocks, the magnitude of which is the offset that needs to be added to ZH at that particular azimuth. Due to multiple blocks along rays, need to breakdown the azimuth-ZH scatter plots by range. Use higher elevation angles to fill In for severe blocks and filtered clutter. Goal is to create a single low-level sweep with good ray-to-ray consistency. Currently do not correct ZDR – set to missing in blocks Mountain Clutter Minor Block Ocean Mean clear-air power over several hours by azimuth, 0.8° elevation Example 2-D composite ZH S-Pol 24-h Ops 7/8-8/21; Two Modes Climatology Used most frequently; 200-km range Full-volume 360s, complete in 15 min Rain-map angles (0.8,1.3,1.8°) & 0.0° Storm Microphysics 70-80 hours total spread over ~35 cases Usually 150-km range 2-3 PPIs with 0-1 RHIs in 15 min 360s @ rain-map angles (0.8,1.3,1.8°) Mtns Ocean Block SMN Upgrade and 24-h Ops Example rainfall product: 1-day total (17 July 2004) Guasave Upgrade completed 6/10 (recorded into Fall) Multiple PRFs; >200-km range Single sweep at 0.5, 1.0, or 1.5° (varied) Data recording outage 7/22-31 Los Cabos Upgrade completed 7/15 Multiple PRFs; >200-km range Single sweep at 0.6° Data recording only thru 8/14 ZH scatter plot for KDP between 1 and 2 ° km-1 by azimuth (date range 8/2-9) 7. Data Distribution Version 1 2-D regional radar composites (0.02° and 0.05° spacing) have been placed on the UCAR/JOSS NAME FTP server. The 0.01° grids are available by request. Quick-look composite images available at http://radarmet.atmos.colostate.edu/name/composites/. Now creating 2-D Version 2 grids, along with 3-D grids containing vertical information from S-Pol, including FHC.Available soon. 2. Basic S-Pol Quality Control 8. Acknowledgments • Threshold on HV, (DP) – noise, clutter • Threshold on ZH, ZDR – insects • Threshold on LDR, DP – second trip • 21-pt (3.15 km) finite impulse response (FIR) filter on DP • Adaptive linear fit to calculate KDP (i.e., higher ZH, fewer pts used) • ZH, ZDR rain attenuation correction via DP method (Carey et al. 2000) • ZH corrected for gaseous attenuation (Battan 1973) • Rainfall from CSU blended polarimetric algorithm (Cifelli et al. 2002) (Base Z-R: Z=221R1.25 from gages; Used pol-tune as guide) • Fuzzy hydrometeor ID (FHC) from CSU method (Tessendorf et al. 2005) The engineering side of the S-Pol deployment was led by Don Ferraro of NCAR Earth Observing Laboratory (EOL). Jon Lutz, also of NCAR EOL, provided engineering oversight for the S-pol operation and led the SMN radar upgrade and data collection efforts. He was assisted by Arturo Valdez-Manzanilla of Juarez University and by Armando Rodriguez of SMN. We thank all the other NCAR engineers, technicians and field scientists for contributing to the successful S-pol operation, as well as Robert Bowie of the CSU-CHILL Radar Facility staff who also worked at S-pol. Bob Rilling of NCAR EOL led initial quality control and distribution of the S-Pol and SMN radar data. Further data quality control efforts, as outlined here, were assisted by Chad Chriestenson of CSU. Sounding data were obtained from Richard Johnson and Paul Ciesielski of CSU. We thank the federal and local government agencies in Mexico, in particular SMN, for their cooperation in making the S-Pol deployment and the SMN upgrades possible. The SMN radar upgrades, S-Pol deployment, radar operations, and ensuing research were funded by the National Oceanic and Atmospheric Administration (NOAA; SMN radars) and the National Science Foundation (NSF; S-Pol). NCAR is funded by NSF. PPI of blockage-corrected ZH (left) and a QC flag showing angle used (right) – 0.8° (greens), 1.3° (yellows), 1.8° (reds) 5. Version 2 Plans Version 1 blockage correction currently only corrects up to 5 dB before utilizing higher angle (1.3° or 1.8°; 1.8° never blocked more than 5 dB). KDP using Version 1 method is very noisy; Version 2 fields are much smoother due to improvements in and greater restrictions on KDP computation, greatly reducing spurious values. In Version 2, will correct up to 35 dB before moving to higher scan – better reliance on low-level scans. Version 2 QC will also include improvements to Z-R estimates, including polarimetric tuning and stratiform/convective partitioning of Z-R. Also, SMN attenuation correction will be improved and radar rain estimates validated by gages. Version 2 NAME radar data will be available later this winter. Version 1 available now, with no validation of rain estimates. 3. Basic SMN Quality Control 9. References Battan, L. J., 1973: Radar Observation of the Atmosphere, University of Chicago Press, 324 pp. Carey, L. D., S. A. Rutledge, D. A. Ahijevych, and T. D. Keenan, 2000: Correcting propagation effects in C-Band polarimetric radar observations of tropical convection using differential propagation phase. J. Appl. Meteorol., 39, 1405–1433. Cifelli, R., W. A. Petersen, L. D. Carey, and S. A. Rutledge, 2002: Radar observations of the kinematic, microphysical, and precipitation characteristics of two MCSs in TRMM-LBA. J. Geophys. Res., 29, 10.1029/2000JD0000264. Patterson, V. L., M. D. Hudlow, P. J. Pytlowany, F. P. Richards, and J. D. Hoff, 1979: GATE radar rainfall processing system. NOAA Tech. Memo. EDIS 26, NOAA, Washington, DC, 34 pp. [Available from National Technical Information Service, Sills Building, 5285 Port Royal Road, Springfield, VA 22161.]. Scarchilli, G., E. Gorgucci, V. Chandrasekar, and A. Dobaie, 1996: Self-consistency of polarization diversity measurement of rainfall. IEEE Trans. Geosci. Remote Sens., 34, 22-26. Tessendorf, S.A., L.J. Miller, K.C. Wiens, and S.A. Rutledge, 2005: The 29 June 2000 supercell observed during STEPS. Part I: Kinematics and microphysics. J. Atmos. Sci., in press. • Threshold on NCP, ZH, and Power • Hand edit insects, clutter • Clutter map used to help eliminate clutter at Guasave • Visual and statistical gate-to-gate intercomparison w/ S-Pol to determine calibration offset for ZH • Correct ZH for gaseous attenuation (Battan 1973) • Correct ZH for rain attenuation using GATE method (Patterson et al. 1979) • Used same Z-R as S-Pol • Capped rain rates at ~230 mm h-1 to mitigate ice contamination Contact Info: Timothy Lang, CSU Atmospheric Science, Ft Collins, CO 80523 (970) 491-6944, tlang@atmos.colostate.edu