Download
1 / 16
160 likes | 272 Views
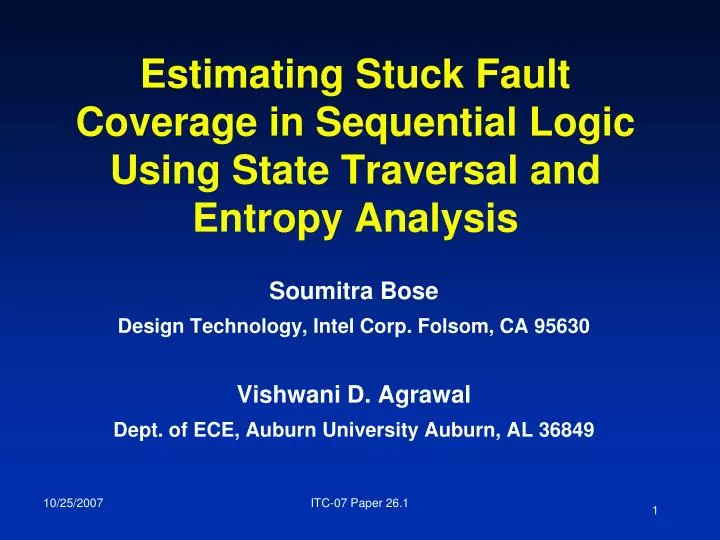
Estimating Stuck Fault Coverage in Sequential Logic Using State Traversal and Entropy Analysis. Soumitra Bose Design Technology, Intel Corp. Folsom, CA 95630 Vishwani D. Agrawal Dept. of ECE, Auburn University Auburn, AL 36849. Outline. Problem & Approach Background State Sequence Analysis

E N D
Estimating Stuck Fault Coverage in Sequential Logic Using State Traversal and Entropy Analysis Soumitra Bose Design Technology, Intel Corp. Folsom, CA 95630 Vishwani D. Agrawal Dept. of ECE, Auburn University Auburn, AL 36849 ITC-07 Paper 26.1
Outline • Problem & Approach • Background • State Sequence Analysis • Entropy Analysis • Algorithm Implementation • Results • Conclusion ITC-07 Paper 26.1
Problem and Approach • Problem • Coverage estimation algorithms inaccurate due to iterative array model. • This results in optimistic estimates, particularly for hard to test designs and when insufficient test vectors are available. • Approach • Use state graph instead of iterative array model. • Reduce size of graph by entropy analysis. ITC-07 Paper 26.1
Dominator Fanout stem Background • Approximate fault simulation • Per-vector analysis • Critical path tracing (CPT), Abramovici et al., IEEE D&T 1984. • Necessary conditions, Akers et al., ITC 1990. • Post-simulation analysis, Stafan, Jain and Agrawal, IEEE-D&T 1985. • Dominator analysis in ATPG, Kirkland and Mercer, ITC 1987. Fault detection at fanout stem depends on signal states in this part and the observability of the dominator. ITC-07 Paper 26.1
Stafan: A Tutorial Example Incorrectly detected faults OB0=1.0, OB1=0.0 (observabilities) C0=0.4, C1=0.6 (controllabilities) S=0.4 (sensitization count) sa0 sa1 Detected faults 11001 sa1 00000 11001 C0=0.4 C1=0.6 sa1 sa1 C0=1.0 C1=0.0 OB0=1.0 OB1=1.0 C0=0.4 C1=0.6 S=1.0 00110 OB0=1.0 OB1=1.0 C0=0.6, C1=0.4 S=0.6 OB0=0.0 OB1=1.0 OB0=1.0, OB1=0.0 pd: Prob(sa0 detected) = C1 × OB1, Prob(sa1 detected) = C0 × OB0 Threshold detection by N vectors: PD(N) = 1 – (1 – pd)N ≥ 0.5 ITC-07 Paper 26.1
(i-1) (i+1) (i) Sequential Logic: Iterative Array Model • Fix-point evaluation: (1) Find observabilities at POs from latch outputs • While latch observabilities change { assign latch input observabilities from latch outputs propagate observabilties from latches across combinational frame } last frame Observability(i) = Detectability(i) + Observability(i+1) ITC-07 Paper 26.1
100 001 G10 G6 010 G3 011 G4 011 000 G9 G5 010 G7 110 G8 010 100 G11 Motivation: Sequential Logic Example Assumptions: (1) G11=1 initially. (2) Gate input states are stored (ITC 2006). (3) Iterative array model used. sa0 101 Non-zero 0-observability at G9 => non-zero 1-observabilty at G11. Iterative array model implies G10 sa0 fault is detectable. Cause for error: Stafan Does not remember G11 = 1 in first vector. ITC-07 Paper 26.1
0*,11 11 001 011 10 10 110 101 01 11 1* 010 000 1* 00 01 01 10 111 100 00 State Sequence Analysis - I (1) Remember preceding states while performing simulation. (2) However, state graph may be too big (max = number of vectors). (3) Collapse states to minimize graph size. States: (f1,f2,f3) Inputs: (i1,i2) Collapse variable f3: (1) Merge states{011,010}. (2) Merge states {001,110}. (3) Original transitions: {1*, 11, 10} (4) New transitions: {1*0,101,111} = {10*,11*} ITC-07 Paper 26.1
1*1,0*1 0*,11 States: (f1,f2,f3) Inputs: (i1,i2) State: (f1, f2) Inputs: (i1,i2,f3) 11 001 011 10 01 00 10 10*,11* 110 101 0*0 01 11 010 000 1* 11 10 1* 00 01 01 10 111 0** 100 00 State Sequence Analysis - II Result of collapsing f3: transitions from {010,010} to {001,000} : {1*, 11, 10} -> { 10*, 11*} ITC-07 Paper 26.1
å H ( s )= - p ( s ). log ( p ( s )) i i 2 i = 0 , 1 Entropy Analysis • State graph minimization done by entropy analysis • Definition: • Low H(s): infrequent 0 (or 1) • Do not collapse state variables • with low values of H(s) • Sample every N cycles during • simulation and collapse those • variables with H(s) > threshold 1 H(s) 0 1 0.5 p(s) ITC-07 Paper 26.1
Max(COBS, NewOBS) COBS NewOBS CS NS Observabilities From Minimized Graphs • Assume: next state NS, current state CS, current observabilities (0-COBS,1-COBS) for all states reachable from NS. • How do we evaluate 0-CBS,1-COBS for CS? • Use restrictor functions: latches that are 1 (0) in CS cannot have non-zero 0-observability (1-observability). • Three steps: (i) Restrict COBS values using NS, (ii) Trace back to derive new values for CS, and restrict the result (NewOBS), and (iii) Update COBS = max(COBS,NewOBS). ITC-07 Paper 26.1
Max(COBS, NewOBS) COBS NewOBS CS NS Accuracy And Speed Tradeoff • Derivation of NewOBS uses partially specified circuit state CS. • If no variables are collapsed, and all inputs are stored => accurate fault simulation by post processing is obtained. • If all state variables are collapsed, and no inputs are stored => iterative array model is obtained. • Observed accuracy and speed depends on entropy threshold used for minimization. ITC-07 Paper 26.1
Exact Coverage/Estimate Comparison Improved accuracy with increased runtimes. Number of states approach length of test (20K). ITC-07 Paper 26.1
Graph Size vs Runtime Comparison Different entropy thresholds chosen: 0.1, 0.2, 0.3, 0.4 ITC-07 Paper 26.1
Graph Size vs Estimate Comparison Different entropy thresholds chosen: 0.1, 0.2, 0.3, 0.4 ITC-07 Paper 26.1
Conclusion • State graph extracted during logic simulation can be used to improve accuracy of fault coverage estimation. • Entropy measures can reduce the size of the graph, and trade off accuracy for speed. • Iterative array estimate and exact fault coverage are two extremes of this algorithm: (1) Iterative array model: single state model (2) Exact fault simulation: fully expanded version that stores all state variables and inputs. • Unaddressed outstanding problems: effective length of detection, structure of extracted graphs etc … ITC-07 Paper 26.1