1 / 1

Figure 3 Spectral domain optical coherence tomography of RNFL thickness in Friedreich ataxia

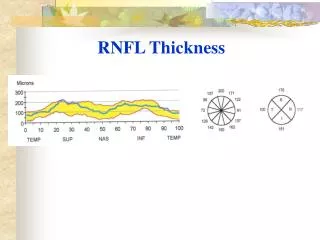
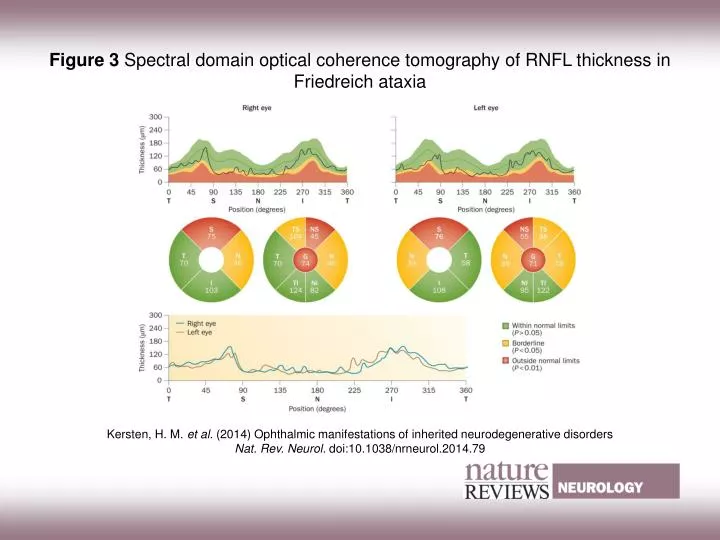
Figure 3 Spectral domain optical coherence tomography of RNFL thickness in Friedreich ataxia. Kersten, H. M. et al. (2014) Ophthalmic manifestations of inherited neurodegenerative disorders Nat. Rev. Neurol. doi:10.1038/nrneurol.2014.79.

janina
Download Presentation

Figure 3 Spectral domain optical coherence tomography of RNFL thickness in Friedreich ataxia

An Image/Link below is provided (as is) to download presentation Download Policy: Content on the Website is provided to you AS IS for your information and personal use and may not be sold / licensed / shared on other websites without getting consent from its author. Content is provided to you AS IS for your information and personal use only. Download presentation by click this link. While downloading, if for some reason you are not able to download a presentation, the publisher may have deleted the file from their server. During download, if you can't get a presentation, the file might be deleted by the publisher.

E N D

Presentation Transcript


  1. Figure 3 Spectral domain optical coherence tomography of RNFL thickness in Friedreich ataxia Kersten, H. M. et al. (2014) Ophthalmic manifestations of inherited neurodegenerative disorders Nat. Rev. Neurol. doi:10.1038/nrneurol.2014.79

More Related