Download
1 / 1
30 likes | 157 Views
Local Quality Assessment for Optical Coherence Tomography. P.C. Barnum 1 , M. Chen 2 , H. Ishikawa 3,4 , G. Wollstein 3 , J. Schuman 3,4.

E N D
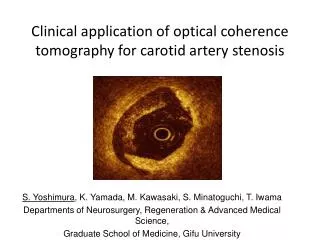
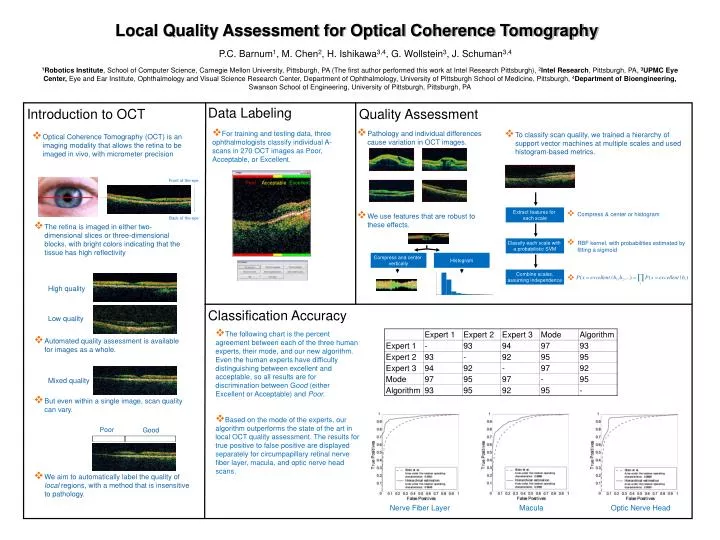
Local Quality Assessment for Optical Coherence Tomography P.C. Barnum1, M. Chen2, H. Ishikawa3,4, G. Wollstein3, J. Schuman3,4 1Robotics Institute, School of Computer Science,Carnegie Mellon University, Pittsburgh, PA (The first author performed this work at Intel Research Pittsburgh), 2Intel Research, Pittsburgh, PA, 3UPMC Eye Center, Eye and Ear Institute, Ophthalmology and Visual Science Research Center, Department of Ophthalmology, University of Pittsburgh School of Medicine, Pittsburgh,4Department of Bioengineering, Swanson School of Engineering, University of Pittsburgh, Pittsburgh, PA Data Labeling Introduction to OCT Quality Assessment • For training and testing data, three ophthalmologists classify individual A-scans in 270 OCT images as Poor, Acceptable, or Excellent. • Pathology and individual differences cause variation in OCT images. • To classify scan quality, we trained a hierarchy of support vector machines at multiple scales and used histogram-based metrics. • Optical Coherence Tomography (OCT) is an imaging modality that allows the retina to be imaged in vivo, with micrometer precision Front of the eye Poor Acceptable Excellent Extract features for each scale • Compress & center or histogram • We use features that are robust to these effects. Back of the eye • The retina is imaged in either two-dimensional slices or three-dimensional blocks, with bright colors indicating that the tissue has high reflectivity Classify each scale with a probabilistic SVM • RBF kernel, with probabilities estimated by fitting a sigmoid Compress and center vertically Histogram Combine scales, assuming independence High quality Classification Accuracy Low quality • The following chart is the percent agreement between each of the three human experts, their mode, and our new algorithm. Even the human experts have difficulty distinguishing between excellent and acceptable, so all results are for discrimination between Good (either Excellent or Acceptable) and Poor. • Automated quality assessment is available for images as a whole. Mixed quality • But even within a single image, scan quality can vary. • Based on the mode of the experts, our algorithm outperforms the state of the art in local OCT quality assessment. The results for true positive to false positive are displayed separately for circumpapillary retinal nerve fiber layer, macula, and optic nerve head scans. Poor Good • We aim to automatically label the quality of local regions, with a method that is insensitive to pathology. Nerve Fiber Layer Macula Optic Nerve Head