Download
1 / 15
160 likes | 439 Views
Vision and Image Processing Laboratory. Sparsity Based Denoising of Spectral Domain Optical Coherence Tomography Images. Leyuan Fang, Shutao Li, Qing Nie, Joseph A. Izatt , Cynthia A. Toth, and Sina Farsiu Biomedical Optics Express , 3(5), pp. 927-942, May, 2012

E N D
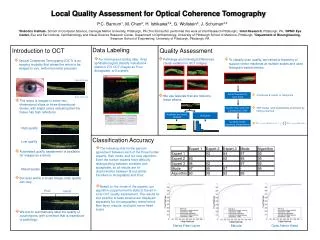
Vision and Image Processing Laboratory Sparsity Based Denoising of Spectral Domain Optical Coherence Tomography Images Leyuan Fang,Shutao Li,Qing Nie,Joseph A. Izatt, Cynthia A. Toth,andSina Farsiu Biomedical Optics Express, 3(5), pp. 927-942, May, 2012 OCTNEWS.ORG Feature Of The Week 6/24/12 Leyuan.Fang@duke.edu
Content 1. Introduction 2. Multiscale structural dictionary 3. Non-local denoising 4. Results comparison 5. Software display
Introduction Two classic denoising frameworks: 1. multi-frame averaging technique 2. model-based single-frame techniques (e.g. Wiener filtering, kernel regression, or wavelets) Low quality denoising result High quality denoising result but requires higher image acquisition time
Proposed Method Overview • We introduce the Multiscale Sparsity Based Tomographic Denoising (MSBTD) framework. • MSBTD is a hybrid more efficient alternative to the noted two classic denoising frameworks applicable to virtually all tomographic imaging modalities. • MSBTD utilizes a non-uniform scanning pattern, in which, a fraction of B-scans are captured slowly at a relatively higher than nominal SNR. • The rest of the B-scans are captured fast at the nominal SNR. • Utilizing the compressive sensing principles, we learn a sparse representation dictionary for each of these high-SNR images and utilize these dictionaries to denoise the neighboring low-SNR B-scans.
Assumption In common SDOCT volumes, neighboring B-scans have similar texture and noise pattern. B-Scan acquired from the location of the blue line B-Scan acquired from the location of the yellow line summed-voxel projection (SVP) en face SDOCT image
Sparse Representation How to learn the dictionary? Sparse coefficients SDOCT image or its patches Dictionary to represent the SDOCT image Our paradigm: Learn the dictionary from the neighboring high-SNR B-scan Classic paradigm: Learn the dictionary directly from the noisy image Train by K-SVD Train by PCA Train by K-SVD
Multiscale structural dictionary To better capture the properties of structures and textures of different size, we utilize a novel multi-scale variation of the structural dictionary representation.
Non-local strategy To further improve the performance, we search for the similar patches in the SDOCT images and average them to achieve better results. The MSTBD denoising process
Results comparison Quantitative measures 1. Mean-to-standard-deviation ratio (MSR) where and are the mean and the standard deviation of the foreground regions 2. Contrast-to-noise ratio (CNR) where and are the mean and the standard deviation of the background regions 3. Peak signal-to-noise-ratio (PSNR) where is the hth pixel in the reference noiseless image , represents the hth pixel of the denoised image , is the total number of pixels, and is the maximum intensity value of
Results comparison Experiment 1: denoising (on normal subject image) based on learned dictionary from a nearby high-SNR Scan Averaged image Noisy image (Normal subject) Result using the Tikhonov method [1] MSR = 10.64, CNR = 3.90 MSR = 3.20, CNR = 1.17 MSR = 7.65, CNR = 3.25, PSNR = 23.35 Result using the NEWSURE method [2] Result using the KSVD method [3] Result using the BM3D method [4] MSR = 7.85, CNR = 2.87, PSNR = 24.51 MSR = 13.26, CNR = 5.19, PSNR = 28.48 MSR = 11.96, CNR = 4.72, PSNR = 28.35 [1] G. T. Chong, et al., “Abnormal foveal morphology in ocular albinism imaged with spectral-domain optical coherence tomography,” Arch. Ophthalmol. (2009). [2] F. Luisier, et al., “A new SURE approach to image denoising: Interscale orthonormal wavelet thresholding,” IEEE Trans. Image Process (2007). [3] M. Elad, et al., “Image denoising via sparse and redundant representations over learned dictionaries,” IEEE Trans. Image Process. (2006). [4] K. Dabov, et al., “Image denoising by sparse 3-D transform-domain collaborative filtering,” IEEE Trans. Image Process. (2007). Result using the MSBTD method MSR = 15.41, CNR = 5.98, PSNR = 28.83
Results comparison Experiment 1: denoising (on dry AMD subject image) based on learned dictionary from a nearby high-SNR Scan Averaged image Noisy image (AMD subject) Result using the Tikhonov method [1] MSR = 10.20, CNR = 3.75 MSR = 3.46, CNR = 1.42 MSR = 8.12, CNR = 3.92, PSNR = 21.76 Result using the NEWSURE method [2] Result using the KSVD method [3] Result using the BM3D method [4] MSR = 8.04, CNR = 3.39, PSNR = 23.87 MSR = 12.82, CNR = 5.62, PSNR = 26.07 MSR = 12.08, CNR = 5.31, PSNR = 25.68 [1] G. T. Chong, et al., “Abnormal foveal morphology in ocular albinism imaged with spectral-domain optical coherence tomography,” Arch. Ophthalmol. (2009). [2] F. Luisier, et al., “A new SURE approach to image denoising: Interscale orthonormal wavelet thresholding,” IEEE Trans. Image Process (2007). [3] M. Elad, et al., “Image denoising via sparse and redundant representations over learned dictionaries,” IEEE Trans. Image Process. (2006). [4] K. Dabov, et al., “Image denoising by sparse 3-D transform-domain collaborative filtering,” IEEE Trans. Image Process. (2007). Result using the MSBTD method MSR = 15.28, CNR = 6.45, PSNR = 26.11
Results comparison Experiment 2: denoising based on learned dictionary from a distant high-SNR scan Summed-voxel projection (SVP) en face image Noisy image acquired from the location b MSR = 3.10, CNR = 1.01 Result using the KSVD method [1] Result using the BM3D method [2] Result using the MSBTD method MSR = 13.93, CNR = 5.03 MSR = 14.93, CNR = 5.46 MSR = 18.57, CNR = 6.88 [1] M. Elad, et al., “Image denoising via sparse and redundant representations over learned dictionaries,” IEEE Trans. Image Process. (2006). [2] K. Dabov, et al., “Image denoising by sparse 3-D transform-domain collaborative filtering,” IEEE Trans. Image Process. (2007).
Results comparison Experiment 2: denoising based on learned dictionary from a distant high-SNR scan Summed-voxel projection (SVP) en face image Noisy image acquired from the location c MSR = 3.30, CNR = 1.40 Result using the KSVD method [1] Result using the BM3D method [2] Result using the MSBTD method MSR = 10.30, CNR = 4.95 MSR = 9.91, CNR = 4.70 MSR = 11.71, CNR = 5.35 [1] M. Elad, et al., “Image denoising via sparse and redundant representations over learned dictionaries,” IEEE Trans. Image Process. (2006). [2] K. Dabov, et al., “Image denoising by sparse 3-D transform-domain collaborative filtering,” IEEE Trans. Image Process. (2007).
Software display MATLAB based MSBTD software & dataset is freely available at http://www.duke.edu/~sf59/Fang_BOE_2012.htm Input the test image Input the Averaged image Setting the parameters for the MSBTD Run the Tikhonov Save the results Run the MSBTD Select region from the test image Select a background region from the test image Select a foregournd region from the test image
CLICK ON THE GUI TO PLAY VIDEO DEMO OF THE SOFTWARE MATLAB based MSBTD software & dataset is freely available at http://www.duke.edu/~sf59/Fang_BOE_2012.htm