Download
1 / 31
390 likes | 503 Views
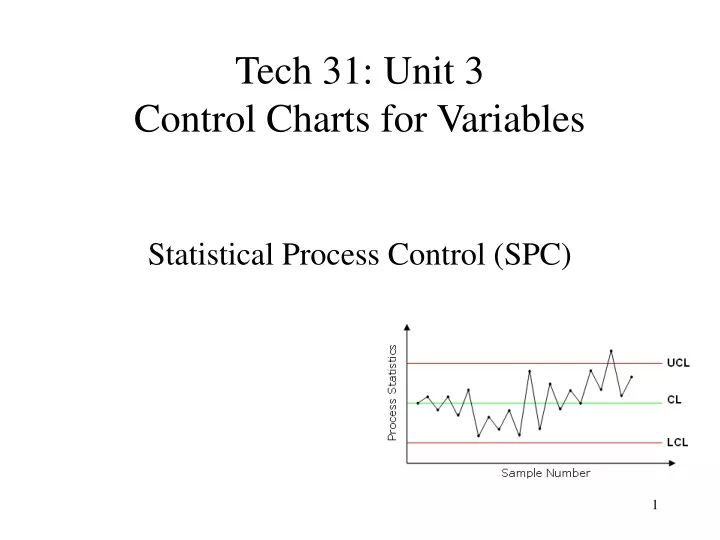
Tech 31: Unit 3 Control Charts for Variables. Statistical Process Control (SPC). Control Charts. Control charts are tools used to determine whether or not a manufacturing process is in a state of statistical control.

E N D
Tech 31: Unit 3Control Charts for Variables Statistical Process Control (SPC)
Control Charts Control charts are tools used to determine whether or not a manufacturing process is in a state of statistical control
Process Variation is Present in Every Process Due to a Combination of Factors: • Equipment • Materials • Environment • Operator
Types of Variation • Within-piece variation • Piece-to-piece variation • Time-to-time variation • Chance causes • Assignable causes
Statistical Process Control • A method of quality control using statistical methods. • Applied in order to monitor and control a process. • Monitoring and controlling the process ensures that it operates at its full potential. • At its full potential, the process can make as much conforming products as possible with a minimum waste, rework or scrap. • SPC can be applied to any process.
Elements of the Control Chart . . UCL = CL+ 3s . . . . X . CL = X LCL = CL - 3s 1 2 3 4 5 6 7 Time/Order
Elements of a Control Chart . . . UCL = CL+ 3s . . . . R CL = R LCL = CL - 3s 1 2 3 4 5 6 7 Time/Order
Determining X-Bar and X-Double Bar • X-Bar = Mean or Average of sub-groups, usually made up of 4 items per sub-group • X-Bar of 4 + 4.2 + 3.9 + 4.1 = 15.3/4 = 3.8 • Class projects will involve 25 subgroups • X-Double Bar is the mean (grand mean) of all the sub-group means
Determining the Control Limits • The control limit is equal to the grand mean • CL = Grand mean or X-double bar • UCL = Upper control limit = CL + 3ϱ • UCL = Upper control limit = CL + A2R-bar • LCL = Lower control limit = CL - 3ϱ • LCL = Upper control limit = CL - A2R-bar
Objectives of Control Charts • For quality improvement • To determine process capability • For decisions in regard to product specifications • For decisions in regard to new and existing production processes
Control Chart Techniques • Select the quality characteristic • Choose the rational subgroup • Collect Data • Determine the trial central line (CL) and control limits (UCL & LCL) • Establish the revised CL, UCL, & LCL • Achieve Objectives
Control Charts Types of Control Charts • Control Chart for Variables • X-bar charts • R charts • The sample standard deviation control chart • The median and range chart • The individual and range chart
Control Charts continued • Control Charts for Attributes • p & np charts • c charts • u charts
State of Control • Process in control • Process out of control
Process Out of Control . . UCL = CL+ 3s . . CL + A2R-bar . . X . CL = X LCL = CL - 3s CL - A2R-bar 1 2 3 4 5 6 7 Time/Order
Analysis of Out-of-Control Condition • Change or jump in level • Trend or steady change in level • Recurring cycles • Two populations (mixture) • Mistakes
Specifications • Individual values compared to averages • Central limit theorem • Control limits and specifications • Process capability and tolerance
Process capability = Six X Sigma UCL A B C CL C B A LCL
Process Capability • Control Limits & Specification Limits • Process Capability = 6s • Process Capability Index: CP = (USL-LSL)/ 6s Cpk = Min{(USL-X-bar) or (LSL-X-bar)}/3s
Six sigma If sigma can be reduced to the point that the specifications are at + or – 6 sigma, then 99.9999998% of the product or service will be within specifications
Different Control Charts • Charts for better operator understanding • Charts for variable subgroup size • Charts for trends • Charts for moving average and moving range • Charts for median and range • Charts for individual values • Charts with non-acceptance limits