Download
1 / 27
370 likes | 795 Views
u -Charts: Attribute Control Chart. By Nathan Westover Brigham Young University November 2012. Agenda. U-Charts Defined Brainstorming Exercise: How can this tool be used in your organization Nuts and Bolts: What are C ontrol Charts?

E N D
u-Charts: Attribute Control Chart By Nathan Westover Brigham Young University November 2012
Agenda U-Charts Defined Brainstorming Exercise: How can this tool be used in your organization Nuts and Bolts: What are Control Charts? Nuts and Bolts: Attribute Control Charts vs. Variable control Charts Nuts and Bolts: What information do u-Charts convey? Nuts and Bolts: How u-Charts are developed? How it works Real World Example Sample Exercise Summary Readings List
U-Charts Defined u-Chart: A control chart that tacks the variation in the average number of defects per unit. Example: XXX company produces cold weather coats. For the X123 model of coat, XXX uses a u-chart to track the average number of defects each coat has from a sample.
Brainstorming Exercise: How can this tool be used in your organization? • Think of a few products or product categories in your company that appear to constantly have defects • Write these down at the top of your notepad • Throughout the presentation think of how you can implement u-Charts with these products
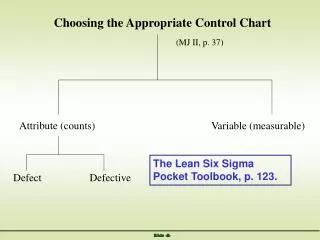
Nuts and Bolts: What are Control Charts? Tools for monitoring process Variation Types of Control Charts
Nuts and Bolts: Attribute Control Charts vs. Variable Control Charts Attribute Control Charts: Process control chart that tracks variation in either-or situations Example: XXX company produces flash memory used in digital MP3 players. XXX uses an attribute control chart to track the proportion of units that are defective Variable Control Charts: Process control chart that tracks variation in continuous measurements such as weight, height, or volume Example: XXX company produces flash memory used in digital MP3 players. XXX uses a variable control chart to track the average number of flash memory that is produced per hour.
Defect Charts: u-Charts vs. c-Charts u-Charts: • Average number of defects per unit • Units do not have to be, but can be from the same sample space • Ex: Average number of defects in a sample of the unibody casing for all sizes of Apple MacbookPro’s c-Charts: • Actual number of Defects per unit • Units must be from the same sample space Ex. Size, Height, Length • Ex: Actual number of defects in a sample of the unibody casing for an Apple 17” Macbook Pro
What information does a u-chart convey and how can it be used? • Non-random Variation in the average number of defects from a given sample space. That sample space can be the same or varied. • This information can then be used in a quality rating system for rating vendors or suppliers, depending on the purpose behind using the chart. • If the chart is for internal use, it can help a company to see the whether the variation is random or not, and can give insight as to what needs to be improved in the process
How are u-chart’s developed/work? • Step 1: • Determine the sample space that is going to be used e.g. Sample amount, Type of product, Varied number of units or standard number • Step 2: • Collect sample data • Step 3: • Create a control chart with upper and lower limits
Creating the Control Chart • Using the sample data, Determine the sum of the defects by adding up all the defects record Sample Data
Creating the Control Chart • Use the Sum to Determine ū Sample Data
Creating the Control Chart • Use the u-Bar to determine UCL and LCL. Because LCL ends up being negative and the LCL cannot go below 0, LCL becomes 0. Sample Data
Creating the Control Chart • Using the sample data, the Upper and Lower Control Limits (UCL and LCL), and u-Bar (Also Known as the Center Line, CL), Create a u-Chart Sample Data
Real World Example Libby’s Cups is a company that makes glass cups for household use. Recently Libby’s managers have been concerned with their cups having too many bubbles in the glass. However, they are unsure if this is just random variation in the process, or if it is a non-random problem that can be addressed. In order to determine whether or not this is non-random variation or not, Libby’s managers decided to randomly select 25 samples from all of their styles of cups and count the total number of defects per sample. The average sample size used is 2.
Real World Example (Sample Data) The following data was taken from 25 randomly selected glass cups
Real World Example Libby’s managers then used the data from the sample to calculate the sample mean/Center Line (CL), the Upper Control Limit (UCL) and the Lower Control Limit (LCL) Equations Results
Real World Example (excel Data Visual) Libby’s Managers then plotted the Data and the control limits into a control chart
Real World Example (Conclusion) Interpretation: After reviewing the chart, Libby’s managers were a bit concerned. It appeared that at certain times there was non-random variation in the number of defects in the cups. They concluded that they were probably overproducing to make sure that they compensated for those that had too many defects. They decided to evaluate the production process more thoroughly to try to reduce the amount of defects or waste in the process.
Sample Exercise You have recently taken a job as the Senior Quality Manager at XtremeToys. Xtreme Toys specializes in making an off-road tricycle for kids. The tricycles it makes comes in several different sizes and colors. In addition they have different size wheels depending on what sort of terrain they are going to be used on. Recently, one of Xtreme Toy’s retailors has been rejecting several lots of tricycles claiming that they have too many defects. After inspecting the returned lots, it appears that the defects seem to appear in the paint finish. Many of the tricycles have scratches in the finish and it appears to be completely random. You are tasked my senior management to determine the cause of these defects. To assist in determining this, you decide to set up a u-chart to monitor the process. Each sample you take will be on average 3 units.
Sample Exercise Data Calculate: Sum of Defects u-bar/ Center Line Upper Control Limit Lower Control Limit Create: u-Chart Analyze: Is the process in Control? If not, Where is it out of control?
Sample Exercise Solutions: Equations Calculations Sum of Defects: U-Bar/Center Line Upper Control Limit Lower Control Limit
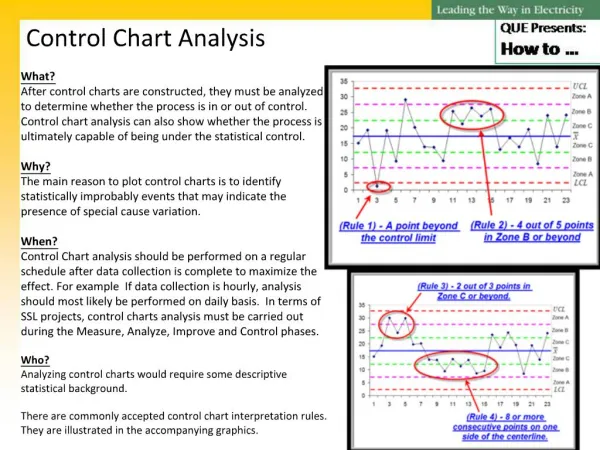
Sample Exercise • Conclusion: • The process appeared to be within the control limits that had been set, however it still appeared to be trending out of control. • Five sample means in a row were above the center line. This indicates that their may be periods of sustained poor performance which could be the root cause of the scratched or damaged lots • Six sample means on a decreasing trend. Because the fewer defect the better, this could indicate that a problem has been fixed and that the process is improving. It would need to be monitored more closely to see if the mean has shifted. • Recommendation: • Shut down the production line and evaluate the cause of the sustained poor performance.
Summary • u-Charts are designed to track the variation in the average number of defects • u-Charts fall into the Attribute category of Control Charts • u-Charts do not have to be from the same sample space and can vary in the number of units per sample. • Three steps to make a u-chart • Step 1: Determine the sample space • Step 2: Collect sample data • Step 3: Create control chart
Reading List Foster, S. Thomas. Managing Quality: Integrating the Supply Chain. 4th ed. Boston: Prentice Hall, 2010. Print. Bhat, K. Shridhara. Total Quality Management. Himalyaya: Himalaya Publishing House. Print.