Download
1 / 6
100 likes | 323 Views
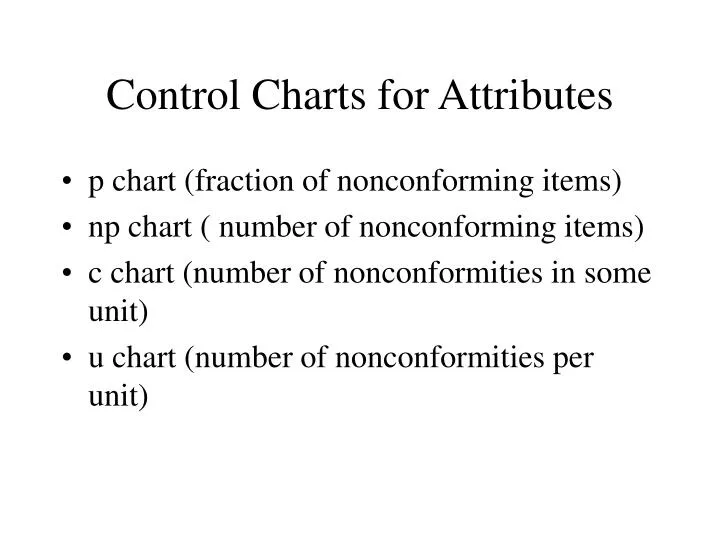
Control Charts for Attributes. p chart (fraction of nonconforming items) np chart ( number of nonconforming items) c chart (number of nonconformities in some unit) u chart (number of nonconformities per unit). The p Chart Procedure.

E N D
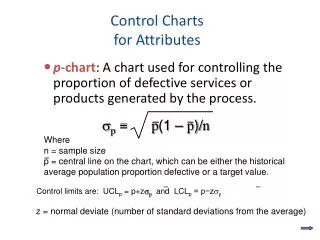
Control Charts for Attributes • p chart (fraction of nonconforming items) • np chart ( number of nonconforming items) • c chart (number of nonconformities in some unit) • u chart (number of nonconformities per unit)
The p Chart Procedure Step1. Gather the data. Select the size, frequency and number of samples. Step2. Calculate p for each sample. Step 3. Set the scale for the control chart. Step 4. Plot the p values and connect them. Step 5. Calculate p-bar, and the control limits after about 20 points have been charted. Step 6. Interpret the chart
Chart Interpretation • Shifts. A shift of seven or more points to a higher or lower level could mean that something has affected the proportion defective or that the definition of what is defective has somehow changed. • Trends. A run of seven or more points up or down indicates that something is causing the proportion that is defective to change in a gradual manner, poorly trained operators, different inspection criteria, or poorly controlled parts in the assembling process.
The np Chart • Standard given: UCL = np0 +3np0 (1-p0) LCL = np0 - 3np0 (1-p0) • No standard given: UCL = x + 3 x (1- x/n) LCL = x - 3 x (1- x/n)
The c Chart • Standard given UCL = c0 + 3 c0 LCL = c0 - 3 c0 • No standard given UCL = c+ 3c LCL = c- 3c
The u Chart(variable unit size) u = c/k k is the number of inspection units in each sample UCL = u0 + 3 u0/k LCL = u0 - 3 u0/k